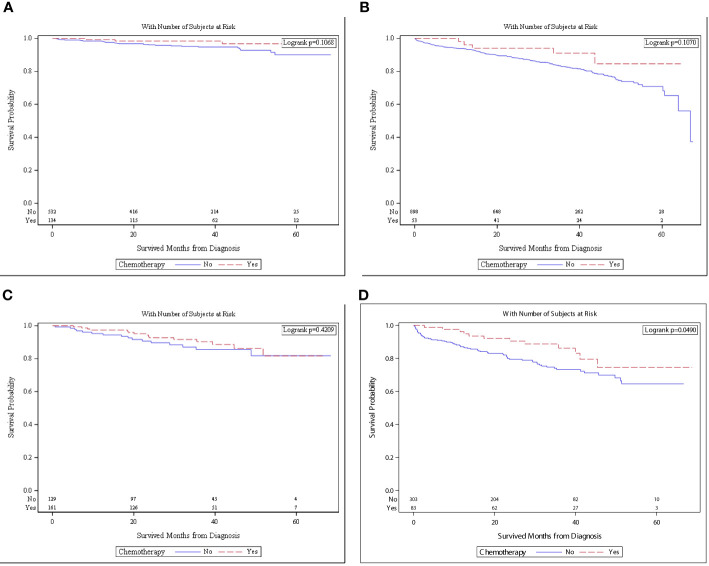
Figure 3.
(A) Survival in patients with no high risk and <65 of age who received chemotherapy (n = 134) versus no chemotherapy (n = 532). (B) Survival in patients with no high risk and ≥65 of age who received chemotherapy (n = 53) versus no chemotherapy (n = 153). (C) Survival in patients with high risk and <65 of age who received chemotherapy (n = 161) versus no chemotherapy (n = 129). (D) Survival in patients with high risk and ≥65 of age who received chemotherapy (n = 83) versus no chemotherapy (n = 303).

