Figure 2.

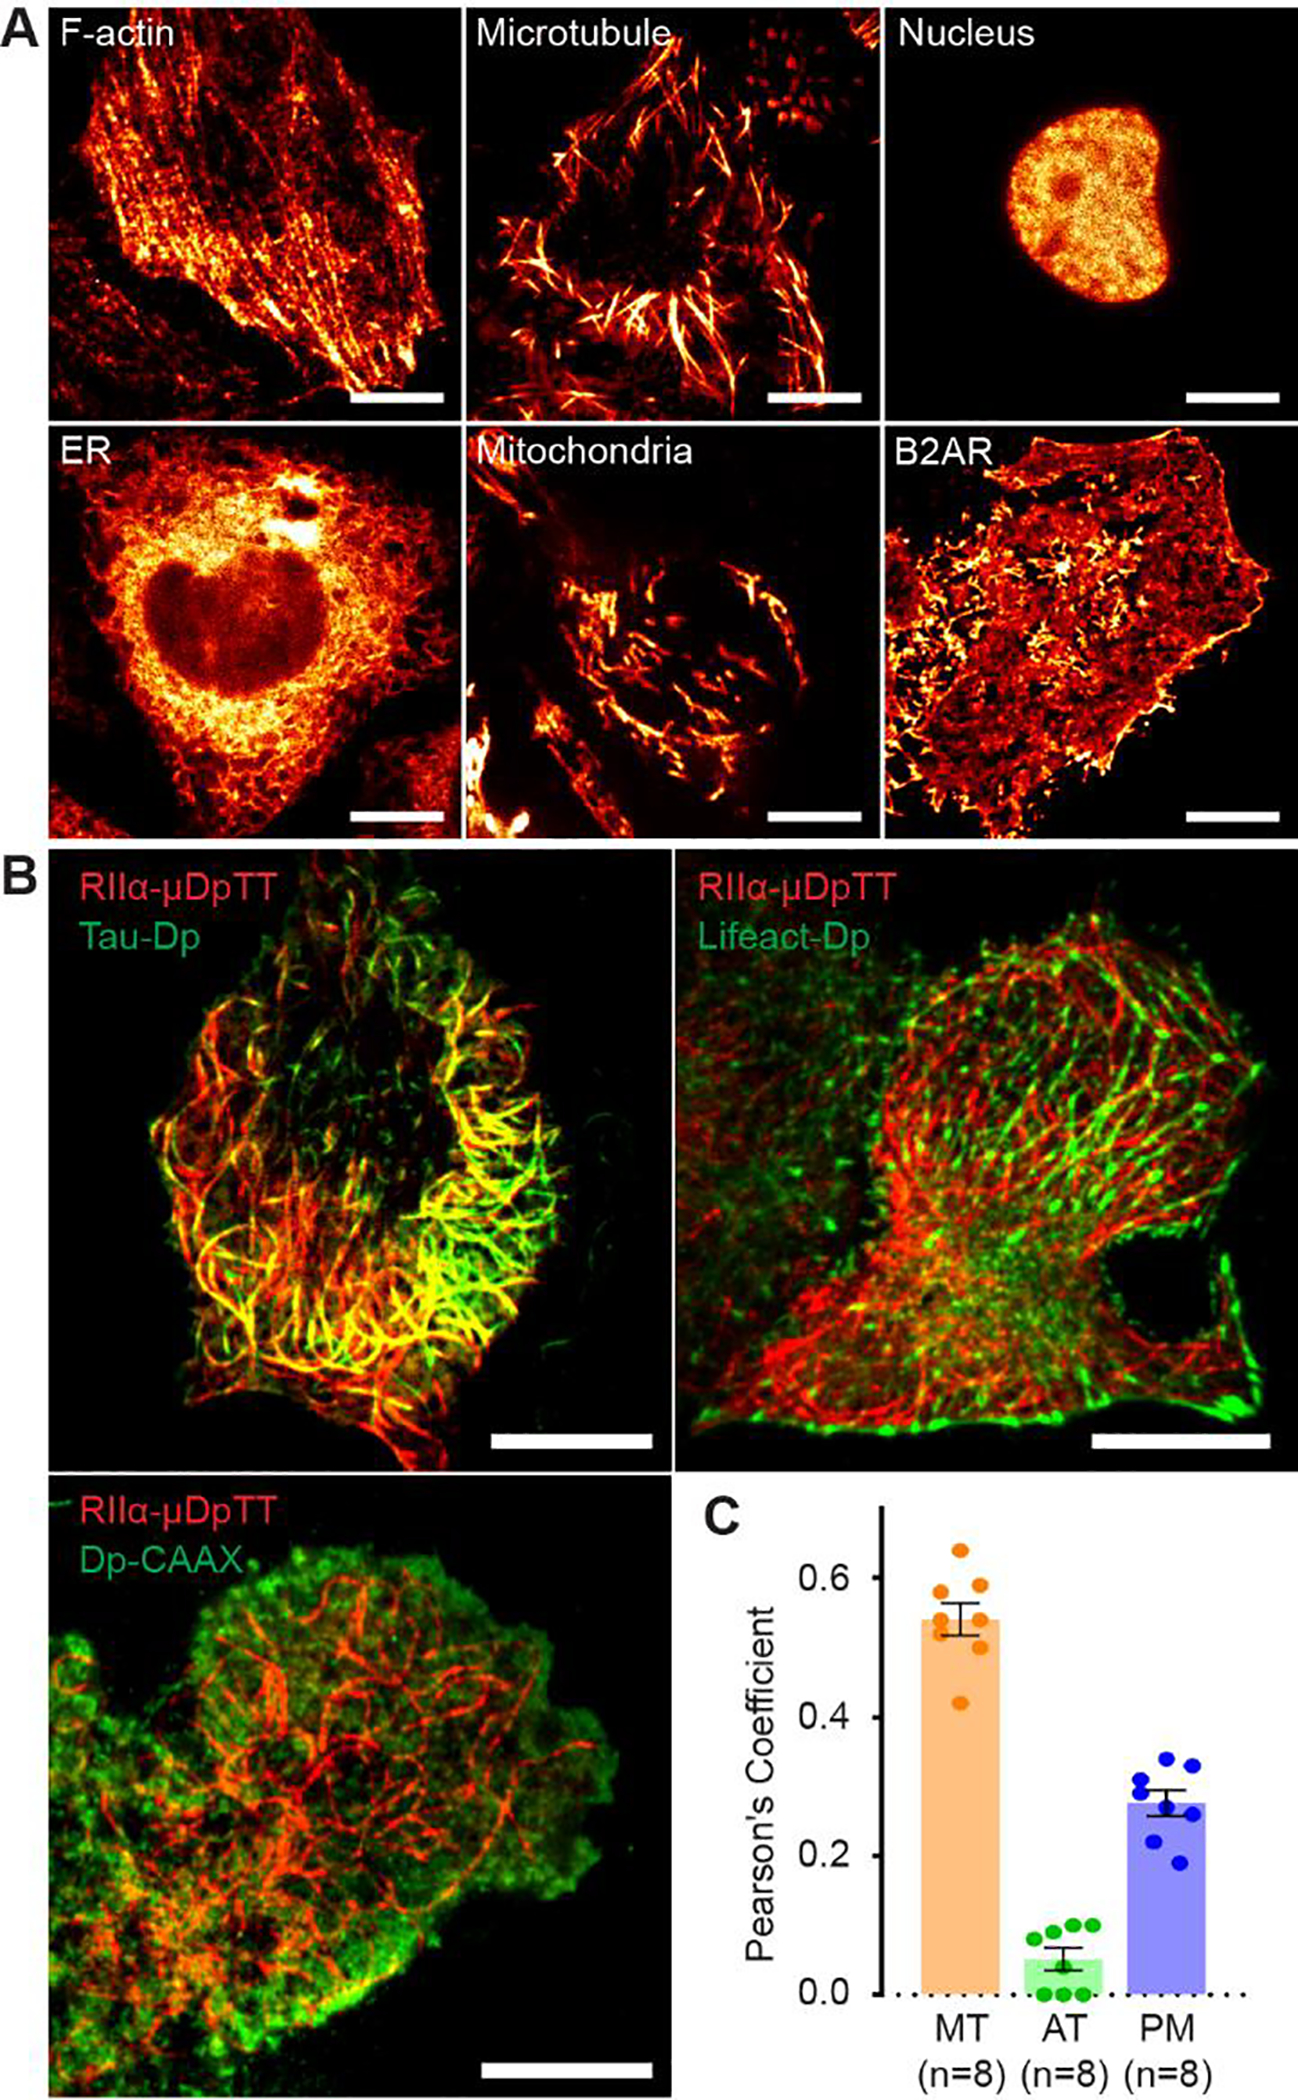
μDpTT is an enhanced, red-photoswitchable FP for multicolor pcSOFI. (A) 2nd order pcSOFI images of HeLa cells expressing μDpTT-labeled subcellular structures, F-actin (Lifeact), microtubules (tau), nucleus (H2B), ER (CYP450 N-terminal), and mitochondria (DAKAP1 N-terminal), as well as a target protein (B2AR). (B) RIIα-μDpTT was co-expressed with tau-Dp, Lifeact-Dp, or Dp-CAAX in MIN6 cells to perform dual-color sequential imaging. (C) Quantitative analysis using Pearson’s coefficient indicates that PKA RIIα mainly localizes on microtubules (MT), but not actin (AT), while a minor pool localizes to the plasma membrane (PM). The error bars represent mean ± s.e.m. Scale bars are all 10 μm.
