Figure 4.

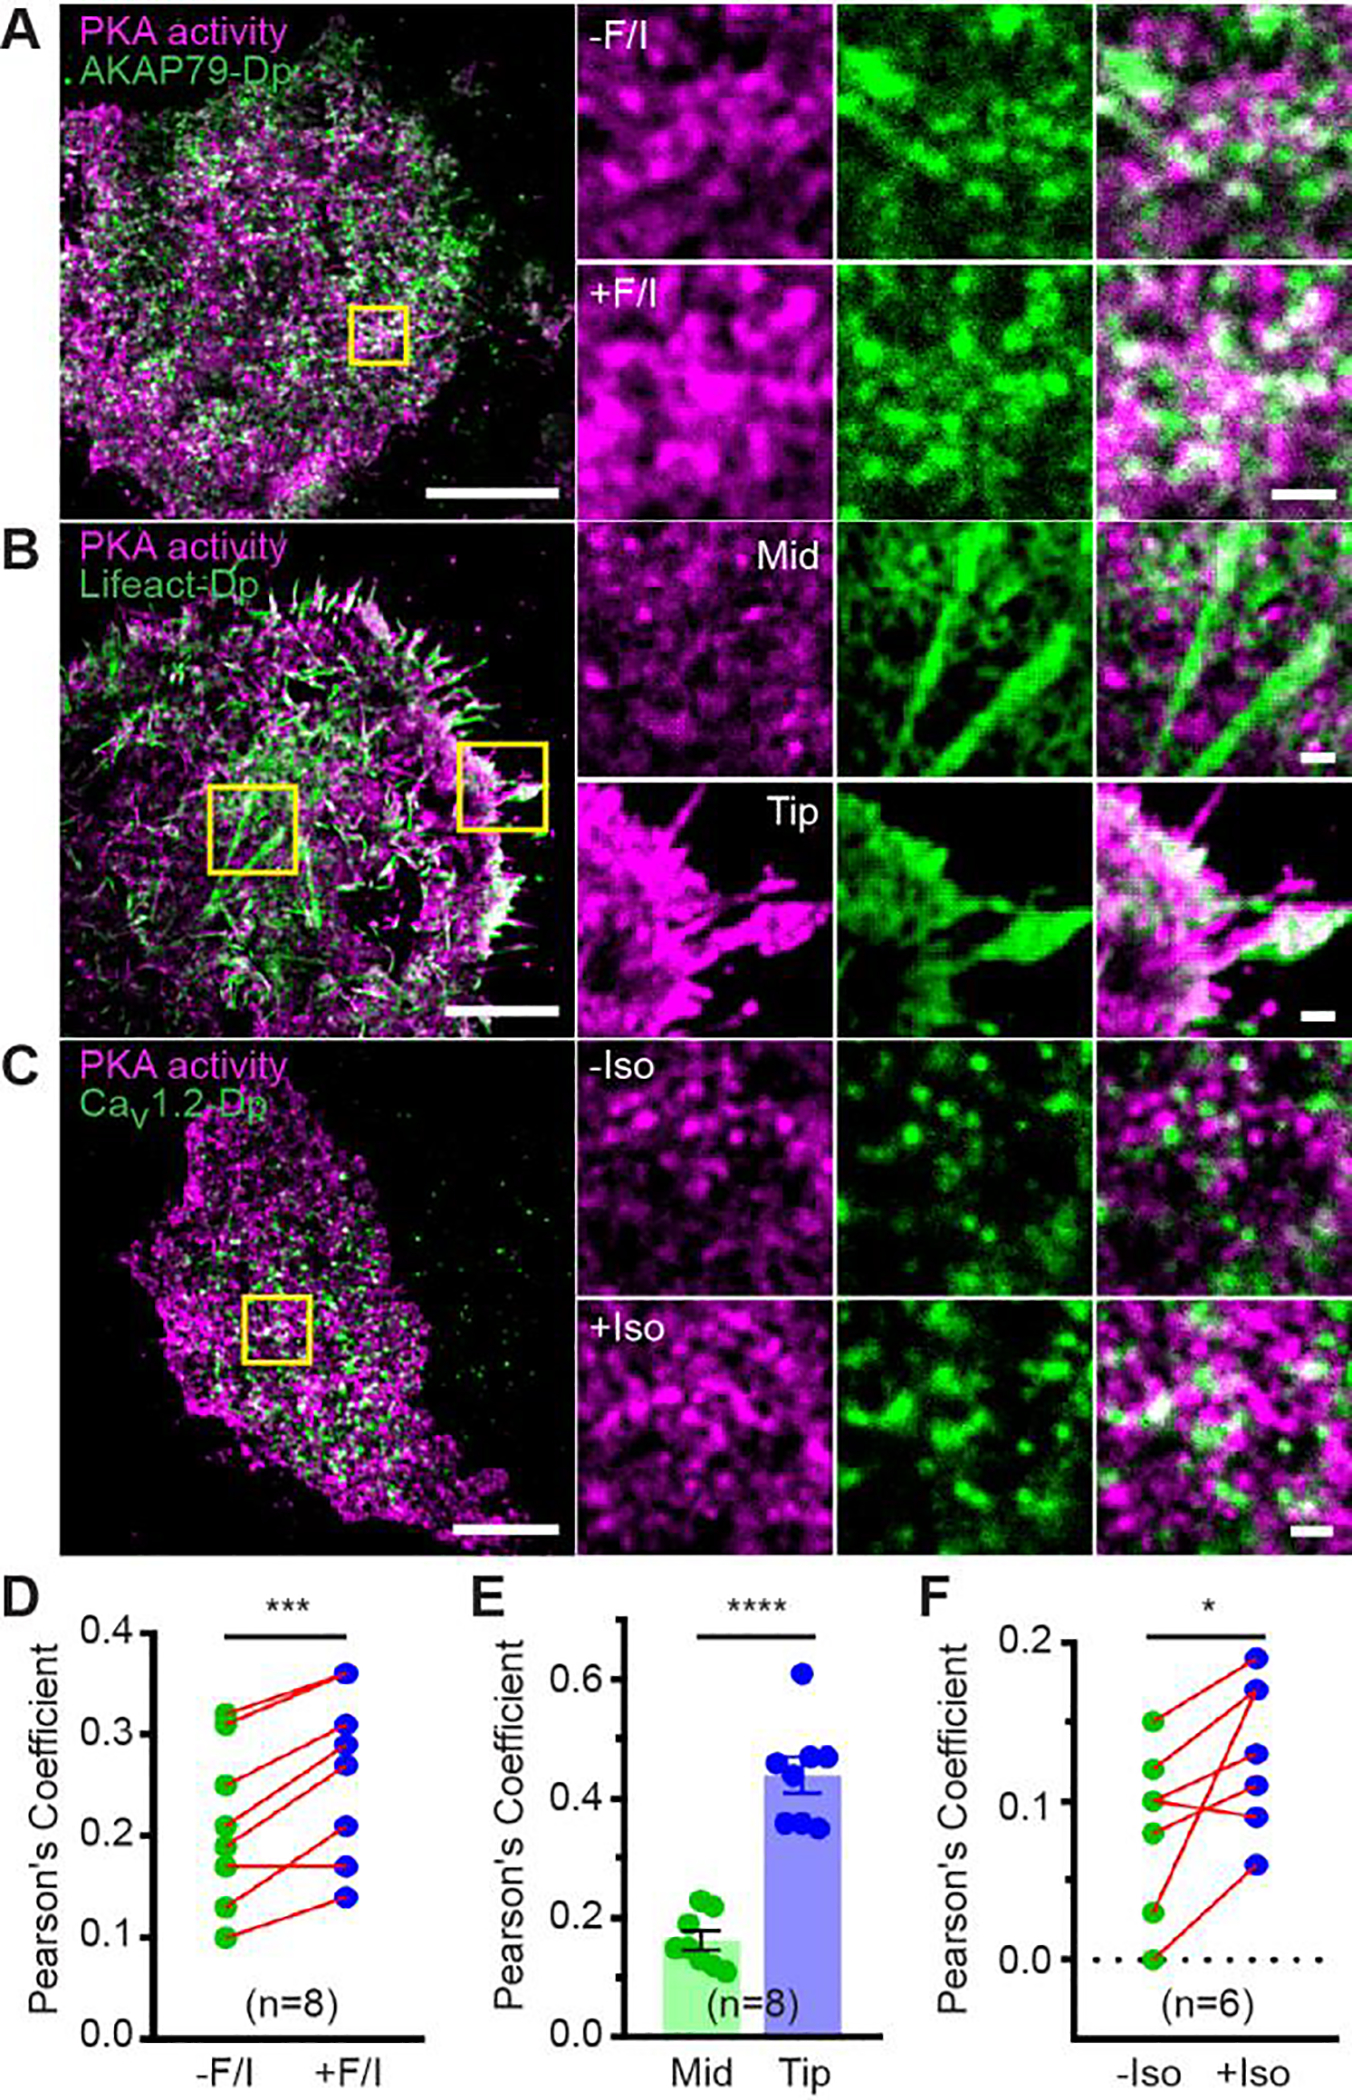
Dual-color pcSOFI imaging of stimulated PKA activity microdomains with regulatory components in living cells. (A-C) The colocalization of stimulated PKA activity microdomains with AKAP79 in HeLa cells (A), F-actin fibers in HeLa cells (B), and the Ca2+ channel protein Cav1.2 in HEK293T cells (C). Zoomed-in views of the boxed regions are shown, where white color indicates colocalization. Scale bars are 10 μm (Zoom in: 1 μm). (D-F) Quantitative analysis using Pearson’s coefficient indicates an increase in colocalization of PKA activities with AKAP79 (D) upon Fsk/IMBX (F/I) stimulation, a higher colocalization at edge protrusions (tip) versus more central (mid) areas (E), and an increase in colocalization of PKA activities with Cav1.2 upon β-adrenergic stimulation (Iso) (F). The error bars represent mean ± s.e.m.
