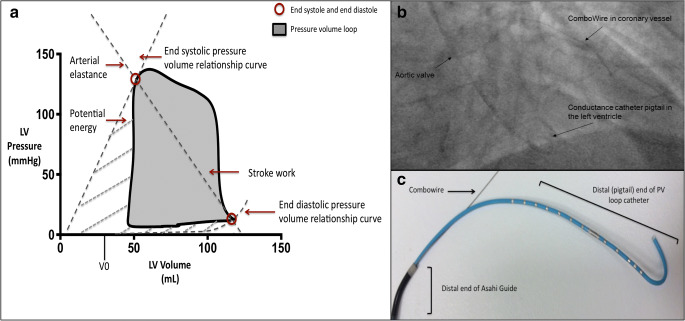
Fig. 1.
An example of data analysis using the PV loop and acquisition with in-vivo fluoroscopic imaging and ex-vivo demonstration of instrumentation. a The pressure-volume (PV) loop and derived measurements. The pressure-volume loop describes a single cardiac cycle by presenting left ventricular pressure as function of volume and facilitates an understanding of cardiac hemodynamics. The end-systolic pressure-volume relationship (ESPVR) line slope (or Ees) represents the load-independent contractile function of the heart. The end-diastolic pressure-volume relationship (EDPVR) line slope (EDPVR) represents the load-independent diastolic properties of the heart. The area of the pressure-volume loop (gray area) represents stroke work (SW), the combination of SW and potential energy (boundary created from the ESPVR and EDPVR lines) represents what is referred to pressure-volume area (PVA or total cardiac work), and arterial elastance is the ratio of end-systolic pressure to stroke volume (Ea). b In vivo fluoroscopic image of real-time simultaneous intracoronary and intraventricular data acquisition. Fluoroscopy was used to confirm (PA view) correct positioning of Combowire in the coronary artery (left anterior descending) and conductance catheter (CC) in the apex of the left ventricle. c Ex vivo image of Asahi sheathless guide with CC and Combowire exiting the guide catheter

