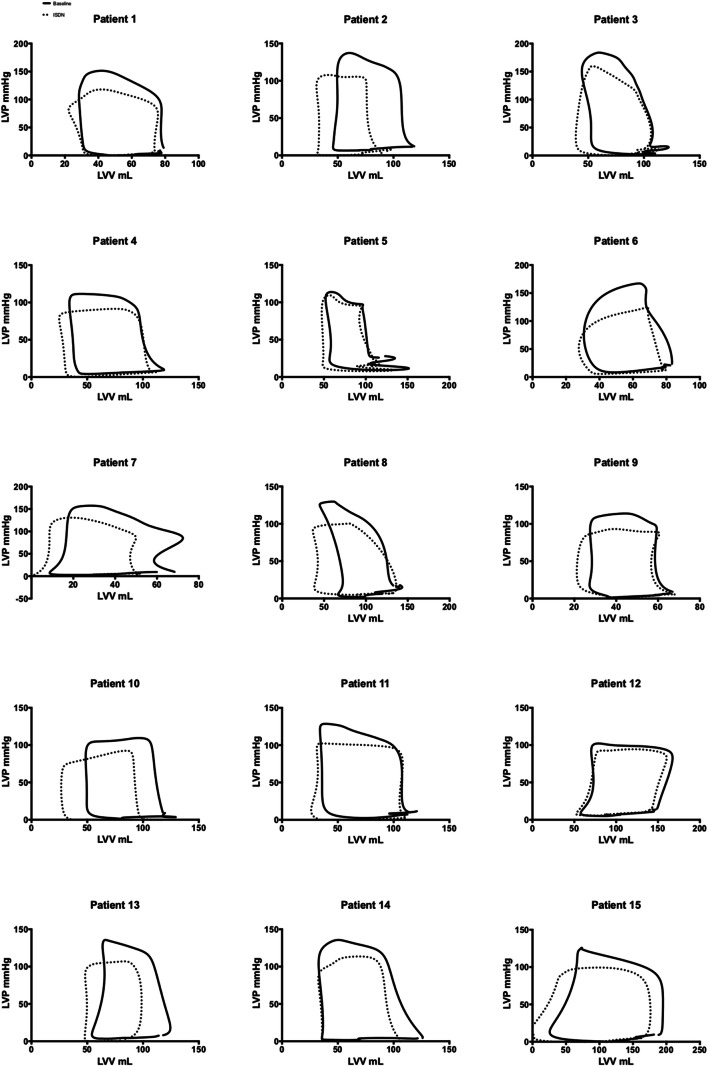
Fig. 2.
Graphical demonstration of changes induced by ISDN and exercise. a–g Heart rate, ST segment, power output, EDP, EDP dPdtmax, and coronary flow velocity changes from baseline following administration of ISDN or dynamic exercise. Measurements are at baseline, 50% peak, and peak effect. H LV pressure-volume relations at baseline (black solid line), 50% peak (broken line), and peak exercise (solid red line). Peak exercise effect is associated with increased myocardial demand, stroke volume, and LV pressures. i LV pressure-volume relations at baseline (black solid line), 50% peak (broken line), and peak ISDN effect (solid red line). Peak ISDN effect is consistent with a decrease in stroke work, increase in LV efficiency, and reduction in myocardial oxygen consumption

