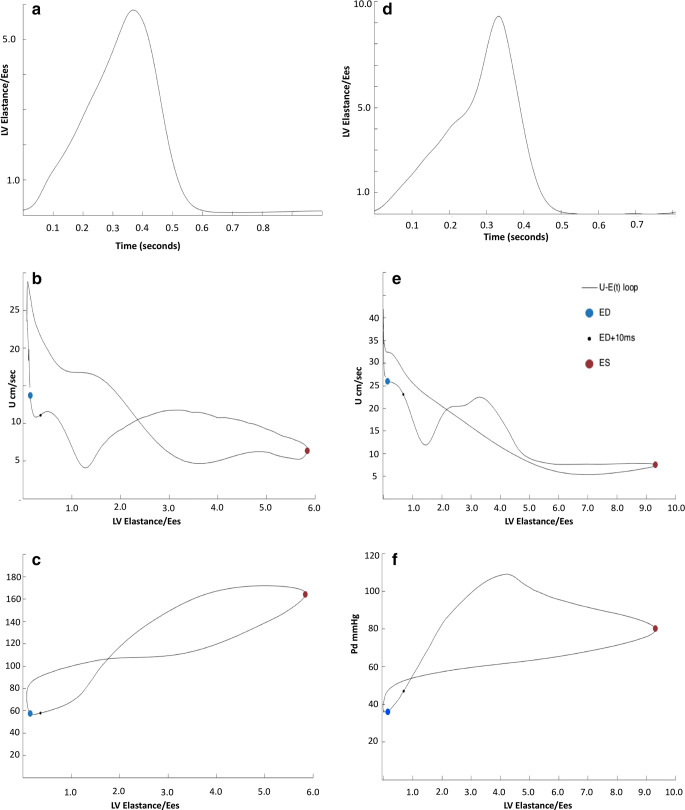
Fig. 6.
Coronary hemodynamics as a function of LV elastance over a single cardiac cycle. In this diagram, we relate cardiac contraction to coronary blood flow velocity and coronary pressure. a to c are under resting/baseline conditions. Cardiac contraction over one cardiac cycle is represented as elastance (instantaneous LV pressure/volume). This generates a bell-shaped curve seen in a. This starts and ends at end-diastole when LV pressure is minimal and peaks in the center at end-systole. The aim of this plot is to represent LV contraction and relaxation over one cardiac cycle. b This is a simultaneous plot of LV elastance (in a) against coronary blood flow velocity to demonstrate how LV contraction-relaxation impacts coronary flow velocity; this is performed under resting, baseline conditions. c This is a simultaneous plot of LV elastance (from a) against distal coronary pressure measured by the Combowire, to demonstrate how LV contraction-relaxation affects coronary artery pressure. d–f are the same plots after IV adenosine administration; the aim is to abolish autoregulatory processes and maximize vasodilatation to see how this changes the cardiac-coronary interaction D LV elastance plotted against time following adenosine E simultaneous plot of LV elastance (in a) against coronary blood flow velocity to demonstrate how LV contraction-relaxation impacts coronary flow velocity following IV adenosine F simultaneous plot of LV elastance (from a) against distal coronary pressure measured by the Combowire, to demonstrate how LV contraction-relaxation affects coronary artery pressure. U coronary blood flow velocity, ED end-diastole, ED+10 end-diastole + 10ms to identify direction of figure of 8 graph over time, ES end-systole

