
FIGURE 10.
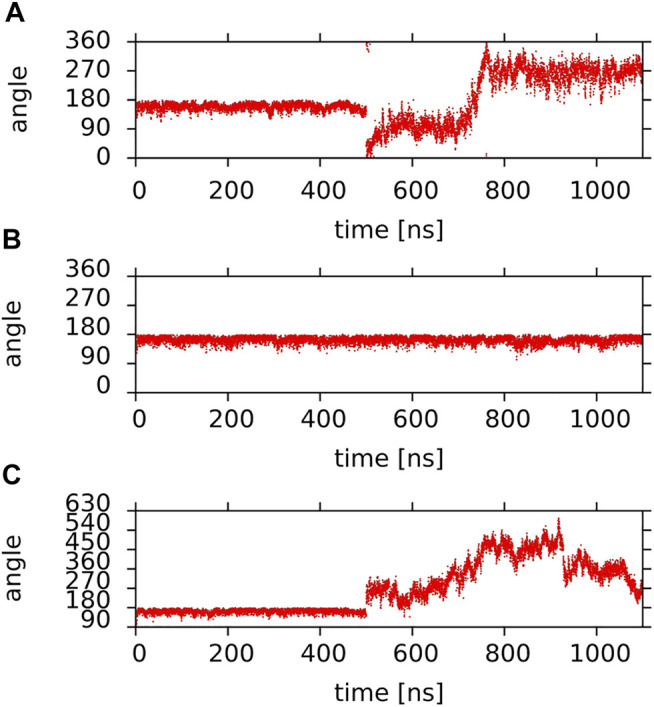
Time profiles of the θ angle of (A,B) lutein molecules (A) #4; (B) #6 in the PC-LUT_H bilayer; (C) zeaxanthin molecule #1 in the PC-ZEA_H bilayer (the y-axis scale was extended to avoid plot discontinuities due to jumps to 0° when 360° is approached). Lutein molecule #4 and zeaxanthin molecule #1 rotated to the vertical position at ∼500 ns of MD simulation (cf. Figure 7 and Supplementary Figure S9) and lutein molecule #6 remained in the horizontal position during the whole simulation time.