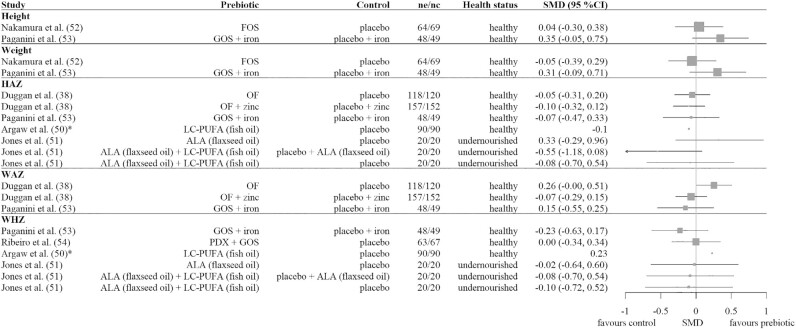
FIGURE 3.
Forest plot of the SMDs with 95% CIs for prebiotic studies. No summary SMD is calculated owing to heterogeneity and the small number of studies. *Mean difference because no SD was given. ALA, α-linolenic acid; FOS, fructo-oligosaccharide; GOS, galacto-oligosaccharide; HAZ, height-for-age z score; LC-PUFA, long-chain PUFA; nc, number of children in the control group; ne, number of children in the experimental prebiotic group; OF, oligofructose; PDX, polydextrose; SMD, standardized mean difference; WAZ, weight-for-age z score; WHZ, weight-for-height z score.

