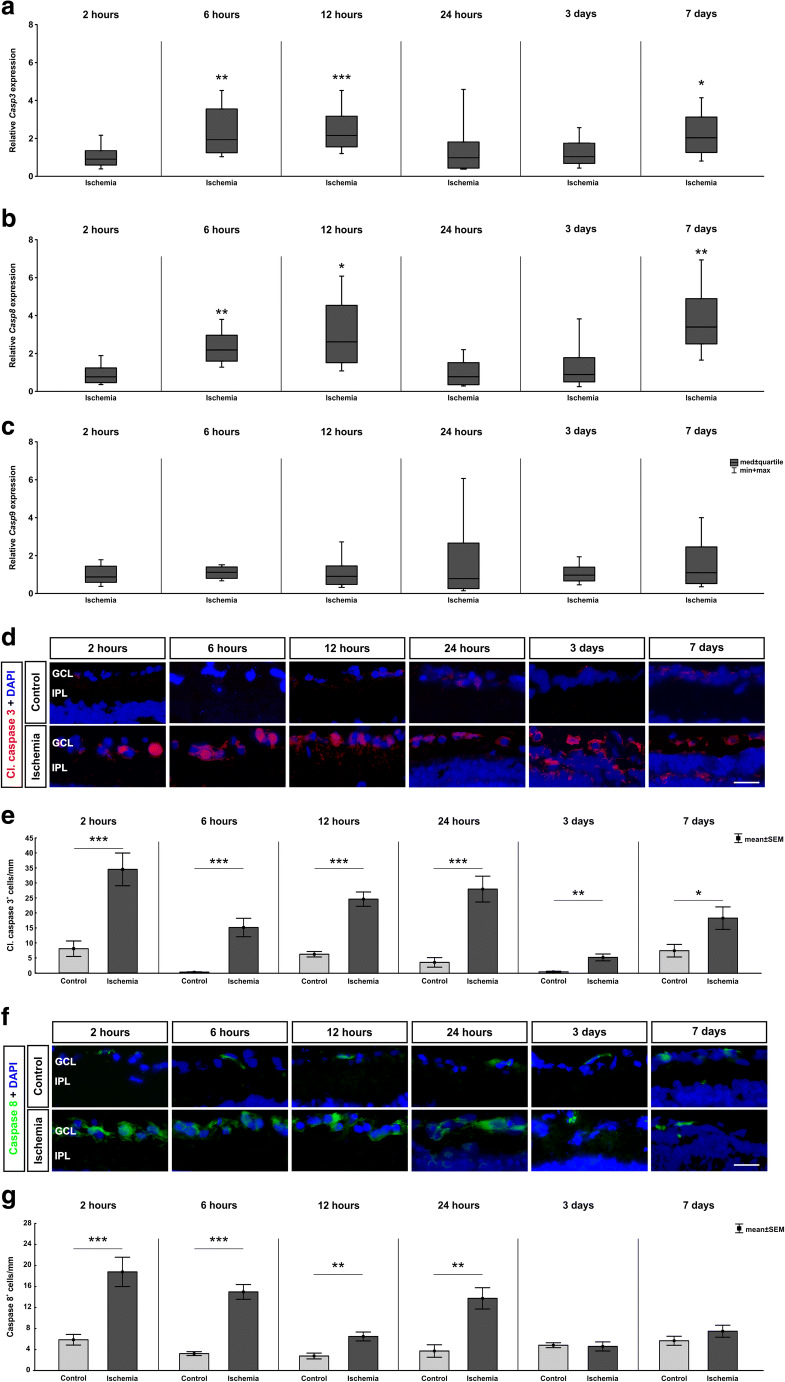
Fig. 6.
Apoptotic processes after ischemic damage. a The relative gene expression level of Casp3 was significantly upregulated in the ischemia group at 6 (p = 0.03) and 12 h (p < 0.001) as well as 7 days (p = 0.002) after ischemia. Nevertheless, no changes in the Casp3 expression were visible after 2 and 24 h as well as at 3 days. b No changes in the Casp8 expression were detectable after 2 and 24 h as well as 3 days. In contrast, at 6 (p = 0.006) and 12 h (p = 0.016) as well as at 7 days (p = 0.009) a significant upregulation in Casp8 expression was discovered. c No differences in the relative Casp9 expression were measured between control and ischemia samples at all investigated time points. d Retinal cross sections were labeled with an anti-cleaved caspase 3 antibody (green), while cell nuclei were stained with DAPI (blue). e More cleaved caspase 3+ cells were seen 2 (p < 0.001), 6 (p < 0.001), 12 (p < 0.001), and 24 h (p < 0.001) as well as 3 (p = 0.001), and 7 days (p = 0.026) after ischemia. f Sections were stained with anti-caspase 8 antibody (red). Cell nuclei were visualized with DAPI (blue). g More caspase 8+ cells were observed in ischemic retinae at 2 h (p < 0.001), 6 h (p < 0.001), 12 h (p = 0.003), and 24 h (p = 0.001). At 3 and 7 days, counts in both groups were comparable. GCL ganglion cell layer, IPL inner plexiform layer. Values are median ± quartile + maximum/minimum for RT-qPCR and mean ± SEM for immunohistology; RT-qPCR: n = 5/group; immunohistology: n = 7/group. *p < 0.05, **p < 0.01, ***p < 0.001. Scale bar 20 μm

