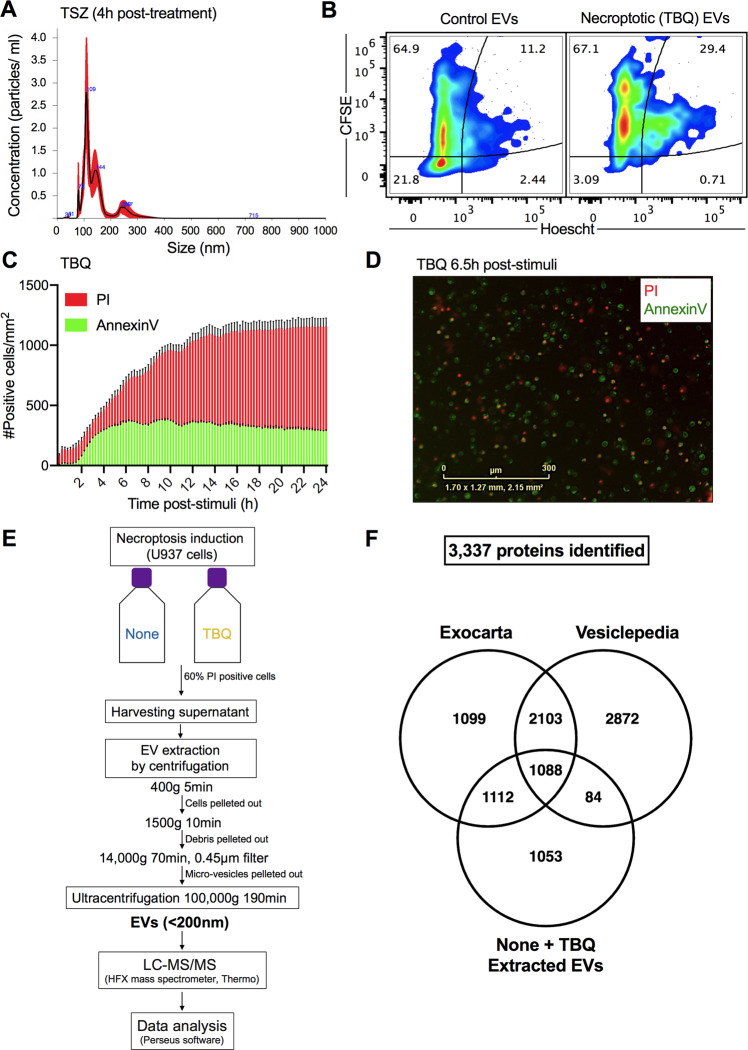
Fig. 1. Extraction of necroptotic extracellular vesicles (EVs).
A U937 cells were treated with TNF-α (1.15 nM), SMAC (AZD5582, 2.5 mM), and z-VAD-fmk (20 mM) (denoted TSZ) to induce necroptosis. After 4 h, EVs were extracted using ultracentrifugation and analyzed for size and concentration by NanoSight. B CFSE-stained U937 cells were treated with TNF-α (1.15 nM), Birinapant (5 mM), and QVD-OPh (20 mM) (denoted TBQ) to induce necroptosis. Five hours later, EVs were extracted using ultracentrifugation, stained with Hoescht33342, and analyzed by flow cytometry (Attune NxT) for CFSE and Hoescht fluorescence intensity to examine their protein and nucleic acid composition, respectively. C, D U937 cells were treated with TBQ as above to induce necroptosis. Cell viability was monitored using AnnexinV-FITC (green) and PI (red) via real-time imaging (IncucyteZoom). C Number of AnnexinV- and PI-positive cells per mm2 at the indicated time points post stimuli. D Representative image of treated cells at 6.5 h post stimuli. E Schematic overview of the experimental and data analysis procedure. U937 cells were left untreated as a control (denoted none) or stimulated for necroptosis (TBQ). When TBQ-treated cells reached 60% PI positivity, supernatants were harvested for serial centrifugation and ultracentrifugation. Six pairs of independently extracted EVs were analyzed as biological replicates by mass spectrometry and Perseus data analysis software. F 3337 proteins were identified in the extracted EVs from both control (none) and necroptotic (TBQ-treated) cells by mass spectrometry. Venn diagram of total proteins identified in either none or TBQ-extracted EVs compared with the exosome proteome data bases, ExoCarta and Vesiclepedia. A, C, D Data are representative of at least three independent experiments. A Data are presented as the mean of five acquired samples ±SEM and representative of three independent experiments. B Plots are representative of duplicate samples. C Data are presented as the mean of triplicate samples ±SD. EVs, extracellular vesicles; TSZ, TNF-α, SMAC, and z-VAD-fmk; TBQ, TNF-α, Birinapant, and QVD-OPh; PI, propidium iodide; h, hours; LC-MS/MS, liquid chromatography with tandem mass spectrometry; SEM, standard error of the mean; SD, standard deviation.

