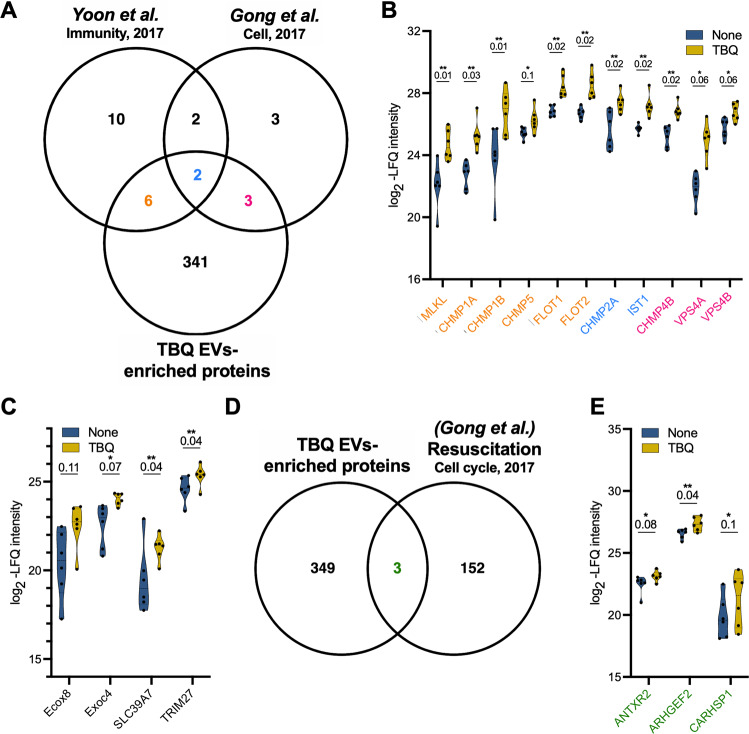
Fig. 4. Necroptotic EVs are abundant with reported and unreported components of vesicle formation and transport and necroptosis signaling pathways.
A Venn diagram of the TBQ EV-enriched proteins compared with proteins that were found using mass spectrometry to associate with MLKL within EVs by Yoon et al. [18] and with proteins that were shown to regulate EV formation and sensitivity to necroptosis by Gong et al. [17]. B Violin plots showing log2-LFQ intensity of overlapping proteins. Protein names are colored according to their overlapping groups in (A). Q-value is mentioned individually above each plot, *Q < 0.1, **Q < 0.05. C Violin plots showing log2-LFQ intensity of selected proteins that were upregulated in necroptotic (TBQ) vs. control (none) EVs. Q-value is mentioned individually above each plot, *Q < 0.1, **Q < 0.05. D Venn diagram of the TBQ EV-enriched proteins compared with genes that were found by RNA-Seq to be upregulated during resuscitation from necroptosis by Gong et al. [19]. E Violin plots showing log2-LFQ intensity of overlapping proteins from (D) (green). Q-value is mentioned individually above each plot, *Q < 0.1, **Q < 0.05. EVs, extracellular vesicles; TBQ, TNF-α, Birinapant, and QVD-OPh; FDR, false discovery rate.

