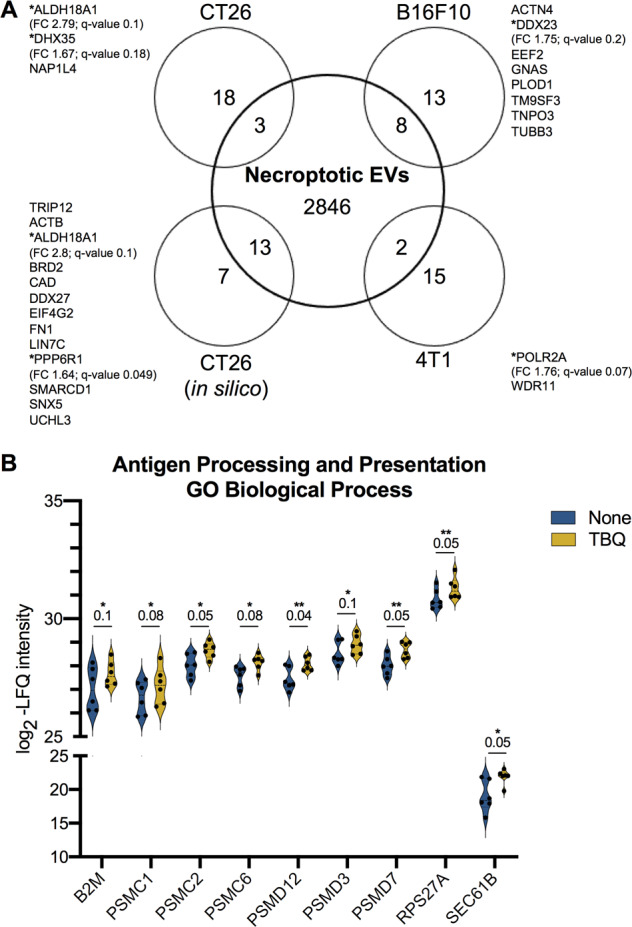
Fig. 6. Necroptotic EVs contain tumor neoantigens.

A Venn diagram of total proteins identified in necroptotic EVs compared with the published tumor neoantigens from B16F10, CT26, 4T1 models or CT26 in silico prediction [58]. TBQ EV-enriched proteins with FDR cutoff of 0.2 are marked with *. Fold change (FC) and Q-value are mentioned for each. B Violin plots showing log2-LFQ intensity of the TBQ EV-enriched proteins annotated as the enriched GO biological process “antigen processing and presentation via MHC class I”. Q-value is mentioned individually above each plot, *Q < 0.1, **Q < 0.05. EVs, extracellular vesicles; FDR, false discovery rate; FC, fold change; TBQ, TNF-α, Birinapant, and QVD-OPh; GO, gene ontology; LFQ, label-free quantification; MHC, major histocompatibility complex.
