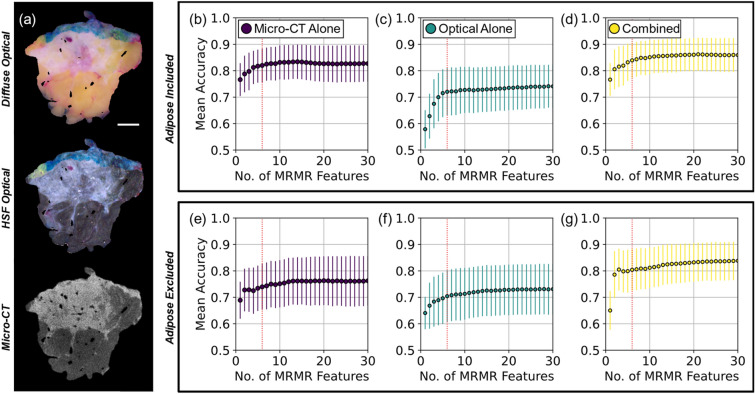
Figure 1.
Mean classification accuracy derived from 5 × 5 mm sub-image samples as a function of the number of optimal MRMR features used in n = 1000 Monte Caro cross-validation splits. (a) Diffuse optical reflectance, high spatial frequency (HSF, 1.37 mm−1) optical reflectance, and a micro-CT slice of a representative tissue specimen with 1-cm scalebar. Mean accuracies when adipose tissue was included (top row, b–d) and excluded (bottom row, e–g). Dashed red vertical lines mark six features, the threshold at which the percent change in mean accuracy dropped below 1% for combined classification in (d) and (g). Error bars represent ± one standard deviation.

