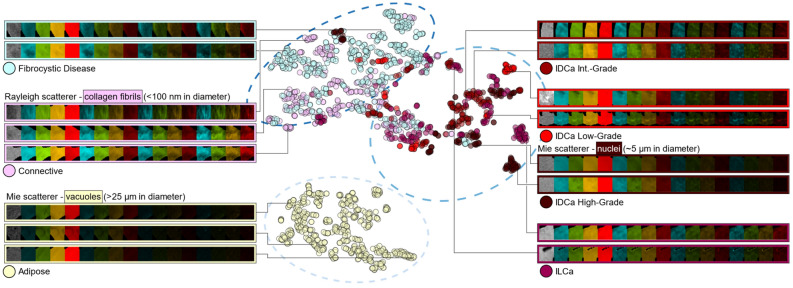
Figure 4.
T-distributed stochastic neighbor embedding using six optimal MRMR radiomic/optomic features (i.e., top features shown in Fig. 3b). Dashed ellipses qualitatively delineate three clusters of samples, which can be related to hierarchical clusters depicted in Supplementary Material Fig. S2. Image channel labels show the micro-CT sub-image on the left (grayscale), followed by calibrated reflectance optical channels with spatial frequency increasing from left to right (0.00, 0.15, 0.61, then 1.37 mm−1). Coloring of optical channels illustrates the wavelength of light, increasing from left to right (490, 550, 600, then 700 nm) and repeated for each spatial frequency. IDCa = invasive ductal carcinoma. ILCa = invasive lobular carcinoma.

