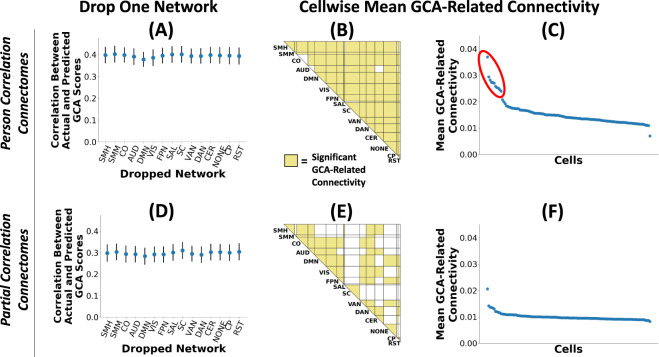
Fig. 4. GCA-related connectivity is widely distributed throughout the brain with a minimal concentration in individual networks.
We performed multiple analyses that convergently support the view that GCA-related connectivity is widespread across the connectome. A We repeated our multivariate predictive modeling analysis dropping one brain network each time. The relatively flat profile in the plot indicates no single network is uniquely important for predicting GCA based on brain connectivity patterns. B We calculated mean GCA-related connectivity for each cell (set of connections linking a pair of networks). Statistical tests revealed significantly elevated GCA connectivity at 110 of 120 network cells. C Plot showing mean GCA-related connectivity for each cell. These values are notably located in a narrow range. We did find somewhat elevated GCA connectivity above in 11 cells (shown in the red circle), and these 11 cells all involve either cingulo-parietal network or retrosplenial network, two small networks in posterior parietal regions. (Bottom Row: D–F). We repeated the three preceding analyses with partial correlation connectomes that allow better estimation of direct connections between regions, and the results were highly similar. SMH somatomotor-hand, SMM somatomotor-mouth, CO cingulo-opercular, AUD auditory, DMN default, VIS visual, FPN frontoparietal, SAL salience, SC subcortical, VAN ventral attention, DAN dorsal attention, CER cerebellum, NONE not named, CP cingulo-parietal, RST retrosplenial temporal.

