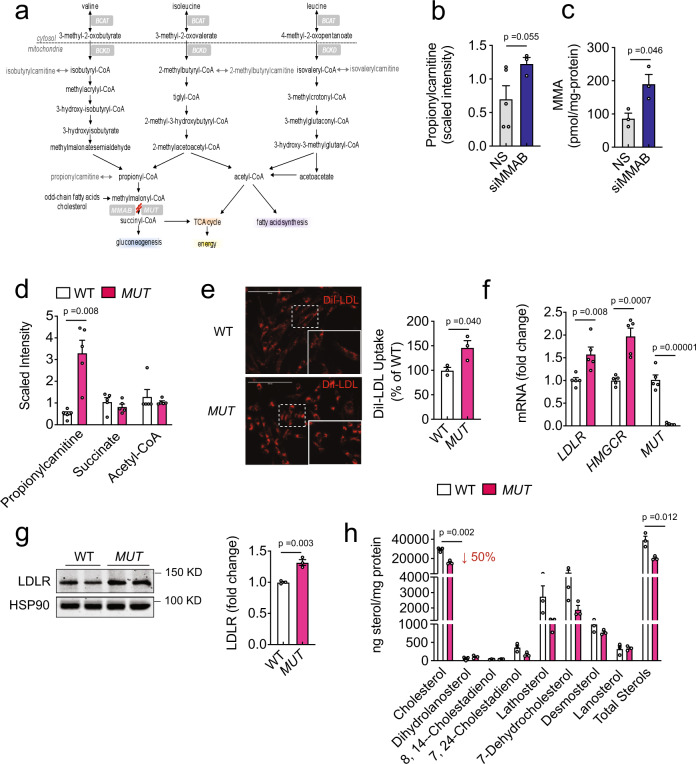
Fig. 5. MUT-deficient human fibroblasts have increased LDLR expression and function and decreased sterol content.
a Catabolism of odd-chain fatty acids, cholesterol, and amino acids. MMAB catalyzes the final step in the conversion of vitamin B12 into adenosylcobalamin (AdoCbl), a coenzyme for methylmalonyl-coA mutase (MUT). Mutations in MMAB or MUT lead to the metabolic disorder, methylmalonic aciduria. b, c Propionylcarntitine (b) and methylmalonic acid (MMA) (c) content in Huh7 cells transfected with a non-silencing siRNA (NS) or siRNA MMAB (siMMAB) for 60 h. Data are mean ± s.e.m. n = 3–5 biological replicates per group. Statistical comparisons by unpaired Welch’s two-sample t test. d Relative levels of propionylcarnitine, succinate and acetyl-CoA in WT and MUT-deficient fibroblasts incubated in DMEM containing 10% LPDS for 24 h. Data are mean ± s.e.m. of five independent experiments. Statistical comparisons by unpaired Welch’s two-sample t test. e Representative images of DiI-LDL uptake in human fibroblasts deficient of methylmalonyl-coA mutase (MUT) or wild-type (WT) controls and incubated with 30 μg/ml DiI-LDL for 2 h at 37 °C. Red, DiI-LDL. Scale, 200 μm. Quantification of DiI-LDL uptake by FACS is shown to the right. Data are mean ± s.e.m. of three independent experiments. Statistical comparisons by unpaired two-sided Student’s t test. f, g qRT-PCR (f) and Western blot (g) analysis of SREBP2 responsive genes in WT and MUT fibroblasts incubated in LPDS for 24 h. HSP90 was used as a loading control. Quantification of blot is shown to the right. Data are mean ± s.e.m. of 3–5 independent experiments in duplicate, respectively. Statistical comparisons by unpaired two-sided Student’s t test. h Sterol content of WT and MUT fibroblasts incubated in DMEM containing 10% LPDS for 24 h. Lipids were extracted and analyzed by GC-MS. “Total sterols” were calculated as the sum of all sterols that could be detected. Data are mean ± s.e.m. of three independent experiments. Statistical comparisons by unpaired two-sided Student’s t test. Source data are provided as a Source Data file.

