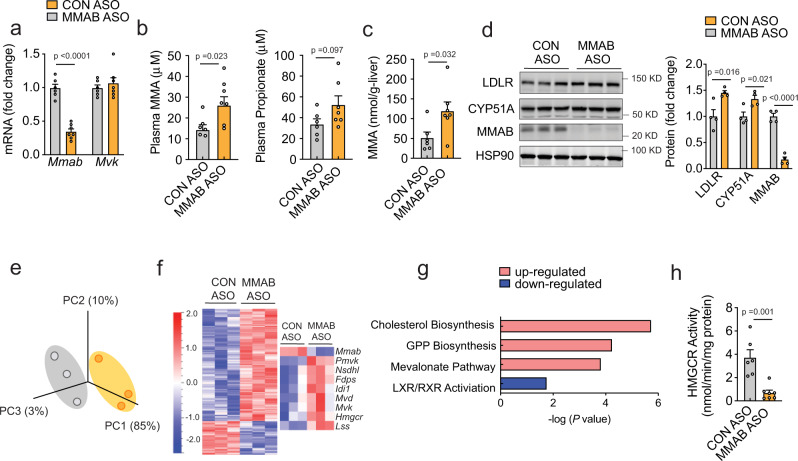
Fig. 7. Knockdown of MMAB reduces HMGCR activity and increases SREBP2-mediated gene expression in vivo.
a qRT-PCR expression of Mmab and Mvk in 8-week-old C57BL/6 (WT) mice treated weekly with 50 mg/kg MMAB antisense oligonucleotide (MMAB ASO) or 50 mg/kg control antisense oligonucleotide (CON ASO) for 6 weeks. Data are mean ± s.e.m. n = 6 CON ASO, 7 MMAB ASO. Statistical comparisons by unpaired two-sided Student’s t test. b Plasma methylmalonic acid (MMA) and propionate in mice treated as in (a). Data are mean ± s.e.m. n = 6 CON ASO, 7 MMAB ASO. Statistical comparisons by unpaired two-sided Student’s t test. c Hepatic methylmalonic acid (MMA) in mice treated as in (a). Data are mean ± s.e.m. n = 6 CON ASO, 7 MMAB ASO. Statistical comparisons by unpaired two-sided Student’s t test. d Representative Western blot analysis of MMAB and SREBP2-responsive genes in the livers of mice treated as in (a). HSP90 was used a loading control. Quantification of blot shown to the right. Data are mean ± s.e.m. n = 4 mice per group. Statistical comparisons by unpaired two-sided Student’s t test. e Principle component (PC) analysis of RNA-seq data from liver tissue of mice treated as in (a). n = 3 mice per group. f Heatmap analysis of hepatic genes differentially expressed between CON ASO and MMAB ASO treated mice. Data are represented as Log2 (MMAB ASO/CON ASO treated) values. Genes in blue are downregulated, while genes in red are upregulated (P ≤ 0.05; FC ≥ 1.5, FC ≤ −1.5). Differentially expressed cholesterol biosynthetic genes are shown to the right (FDR adjusted, P ≤ 0.05; FC ≥ 1.5, FC ≤ −1.5). n = 3 mice per group. g Pathway enrichment analysis of differentially expressed genes in the livers of CON ASO and MMAB ASO treated mice. Pathways with increased activity (positive Z-score) are highlighted in red, while pathways with decreased activity (negative Z-score) are highlighted in blue. See Supplementary Data 6. h HMGCR activity in the livers of mice treated as in (a). Data are mean ± s.e.m. n = 6 CON ASO, 7 MMAB ASO. Statistical comparisons by unpaired, two-sided Mann−Whitney test. Source data are provided as a Source Data file.

