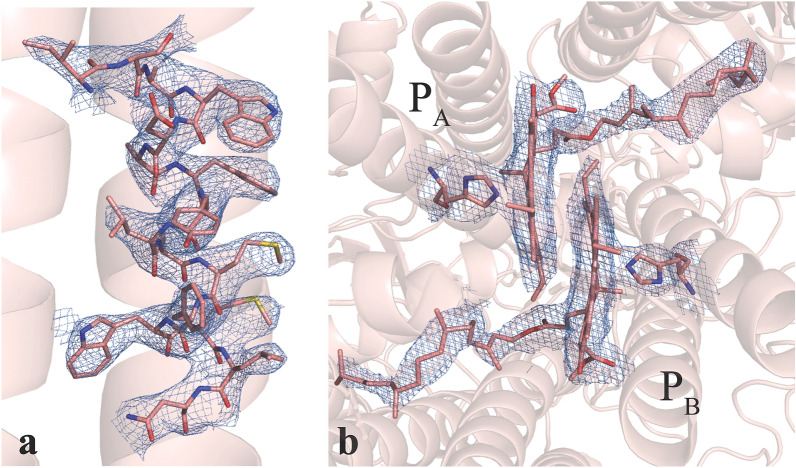
Figure 2.
Electron density of selected regions of the PS I protein complex derived from the 2.75 Å resolution room temperature diffraction data. (a) A portion of a transmembrane alpha-helix (PsaB576–PsaB591) with side chains modeled into 2Fobs − Fcalc electron density contoured to 1.5 . Side chains are clearly visible in this region of the map. (b) Electron density in the region of the special pair P700 formed by a Chl a (labeled PB) and a Chl a’ (labeled PA). Mg2+ coordinating His residues and the Chls are shown as sticks, the 2Fobs − Fcalc electron density is shown as blue mesh contoured at 1.5 . Figure generated with Pymol v. 2.4.0a0, https://pymol.org.

