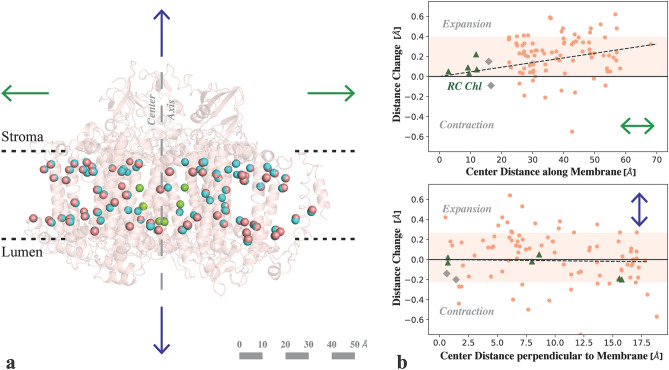
Figure 3.
Comparison of Chl positions in PS I between cryogenic and RT structure. (a) A representation of the central Mg2+ (salmon spheres) of all Chls in one monomer of the PS I RT structure (with backbone shown schematically in salmon) overlaid with the Mg2+ positions from the cryogenic structure (blue). View is along the membrane plane with the stromal side on top and lumenal side on bottom. The center axis, passing through FX and P700 is indicated by a long-dashed line. (b) Distance change (RT minus cryo) of the chlorophylls to the center between P700 and FX either along the membrane (top) or perpendicular to it (bottom). Positive values represent expansion, negative contraction at room temperature. The 1-σ region around the average is highlighted. The Chls involved in charge separation are marked as green triangles, the closest two Chls of the antenna as gray diamonds. The room temperature structure shows an average expansion by about 0.2 Å along the membrane plane. The distance change perpendicular to the membrane is distributed symmetrically around the zero line. Figure generated with Pymol v. 2.4.0a0, https://pymol.org, Python v. 3.7.6, Matplotlib 3.2.1, https://matplotlib.org.

