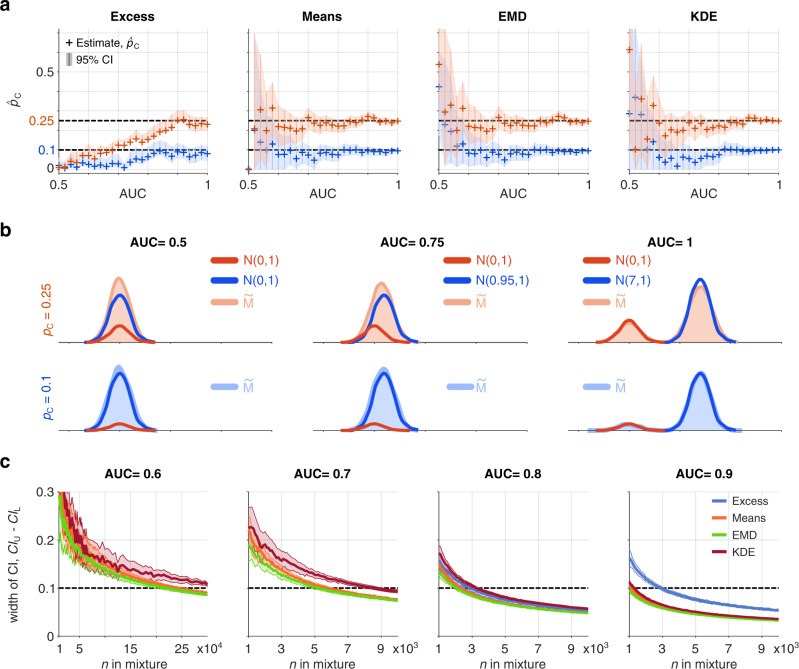
Fig. 4. A comparison of the four methods using an artificial genetic risk score with increasing discriminative ability as measured by AUC, from AUC = 0.5 (no discriminative ability) through to AUC = 1, (complete differentiation).
a The estimated proportion (+ marker) with confidence intervals (vertical lines with shading) around (blue) or (red) for each of the methods (Excess, Means, EMD, KDE) are shown using mixture size, . b The constructed mixture distributions and reference distributions (, shaded red and , shaded blue) from which they were constructed for AUC = {0.5, 0.75, 1}. c Dependence of the width of CI () on the number of points in the mixture sample for AUC = {0.6, 0.7, 0.8, 0.9} and . Curves and shading show median ± standard deviation of the width of CI. The plot for the Excess method for AUC = {0.6, 0.7} is omitted because the method does not converge to . This figure is generated using artificial data: N(μ,σ) is a normal distribution with mean μ = {0.0, 0.08, 0.15, 0.22, 0.29, 0.37, 0.44, 0.51, 0.59, 0.66, 0.74, 0.82, 0.91, 0.99, 1.09, 1.19, 1.29, 1.4, 1.52, 1.65, 1.81. 1.98, 2.19, 2.47, 2.91, 7} and standard deviation σ = 1 and is a mixture of the two normal distributions ( is always N(0,1)). Both reference samples have . For AUC=0.5, means of the constructed mixture samples (for and ) were smaller than both means of the reference samples, in these cases the prevalence estimate from the Means method is assumed to be and confidence intervals are undefined due to undetermined acceleration value.

