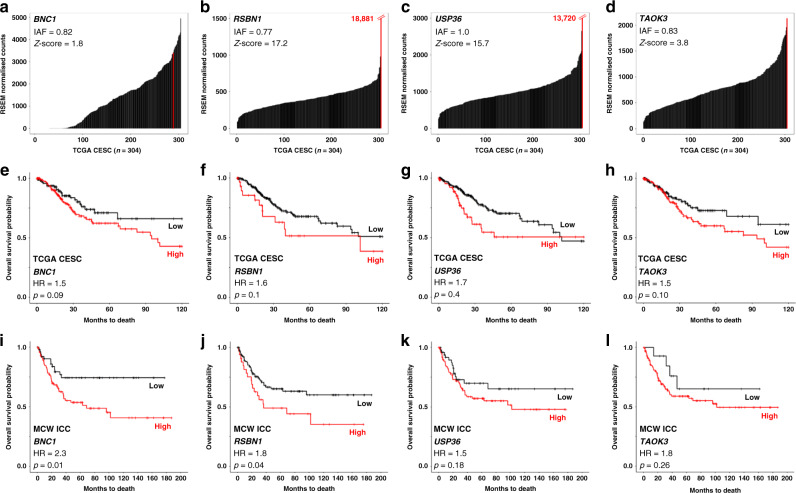
Fig. 1. Filtering and prioritisation results of four candidate IDGs chosen for validation and functional testing.
Clonality (IAF = integration allele fraction) values and Z-score plots for BNC1 (a), RSBN1 (b), USP36 (c), and TAOK3 (d) demonstrate how each IDG passed our first two filtering criteria. Z-score plots depict a black bar for each TCGA ICC sample (x-axis; CESC = cervical squamous cell carcinoma and endocervical adenocarcinoma; n = 304) and their corresponding IDG-specific expression levels (y-axis; TCGA RNAseq data). Red lines mark IDG expression in the integrated tumour. Numerical values in red (b and c) = RSEM values for the integrated tumour. Next, we filtered on the association of BNC1 (e), RSBN1 (f), USP36 (g), and TAOK3 (h) expression with overall survival in the TCGA ICC cohort (HR = hazard ratio). ICC-specific overall survival association of BNC1 (i), RSBN1 (j), USP36 (k), and TAOK3 (l) expression (measured via qRT-PCR) was validated in a second ICC cohort (MCW-ICC; n = 142).

