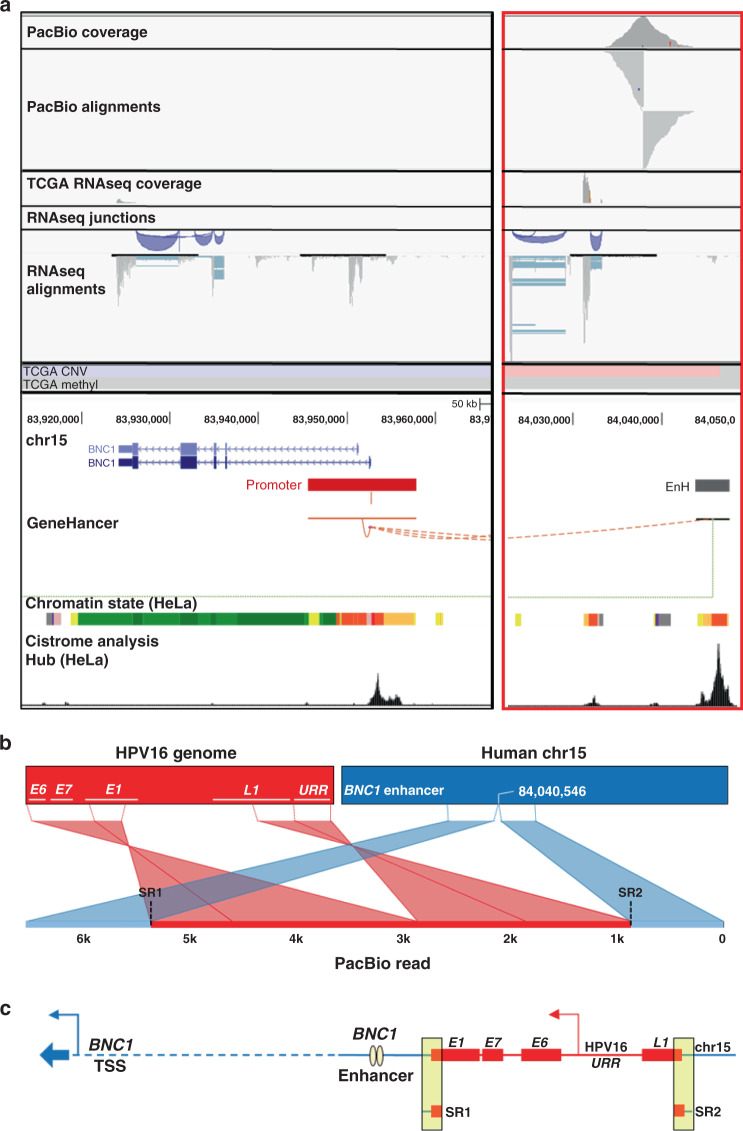
Fig. 2. Annotation of HPV integration affecting BNC1 expression in TCGA-C5-A2LV.
PacBio long-read sequencing, TCGA, and UCSC Genome Browser (http://genome.ucsc.edu) data were used to annotate the HPV integration site proximal to the candidate IDG, BNC1. TCGA-C5-A2LV long-read data (PacBio) and TCGA sequencing (RNAseq), CNV (blue = loss; red = gain), and methylation data (blue = hypomethylation; red = hypermethylation) covering the area of integration (a; red box). The Integrative Genomics Viewer (IGV) was used for the visualisation of PacBio and TCGA RNAseq read alignments. PacBio coverage displays the read depths at each locus with a grey bar chart. PacBio alignments show individual aligned reads, where grey lines represent reads aligning to the human reference genome. For RNAseq, the coverage and alignment tracks are the same, but in between the two is a splice junction track that provides a visualisation of reads spanning splice junctions. Blue lines in the RNAseq IGV image connect reads spanning splice junctions. UCSC Genome Browser GeneHancer track suggests that the integration site is adjacent to a BNC1-specific enhancer (EnH; grey bar) ~88 kb from its promoter (red bar). In addition, HeLa cell-specific cistrome analysis (bottom of a) suggests that these regulatory regions are indeed applicable to cervical cancer. The Ribbon programme was used to generate a schematic of a single PacBio read covering the area of integration, showing how the HPV genome is inserted (red) with human sequence flanking both sides (blue; b). Thick bars across the top (b) represent the HPV and human reference genomes that are connected by dashed lines to a single PacBio read covering the integration to show how it specifically mapped to each genome. Data from all PacBio long reads covering the integration event were used to schematically annotate the integration event (c). Breakpoints identified from TCGA short-read sequencing (SR) of tumour RNA are highlighted in the yellow boxes. The dashed line represents a portion of the human genome not covered by PacBio reads. Collectively, the data support potential HPV integration-induced upregulation of BNC1 enhancer RNA (eRNA), leading to increased BNC1 expression.

