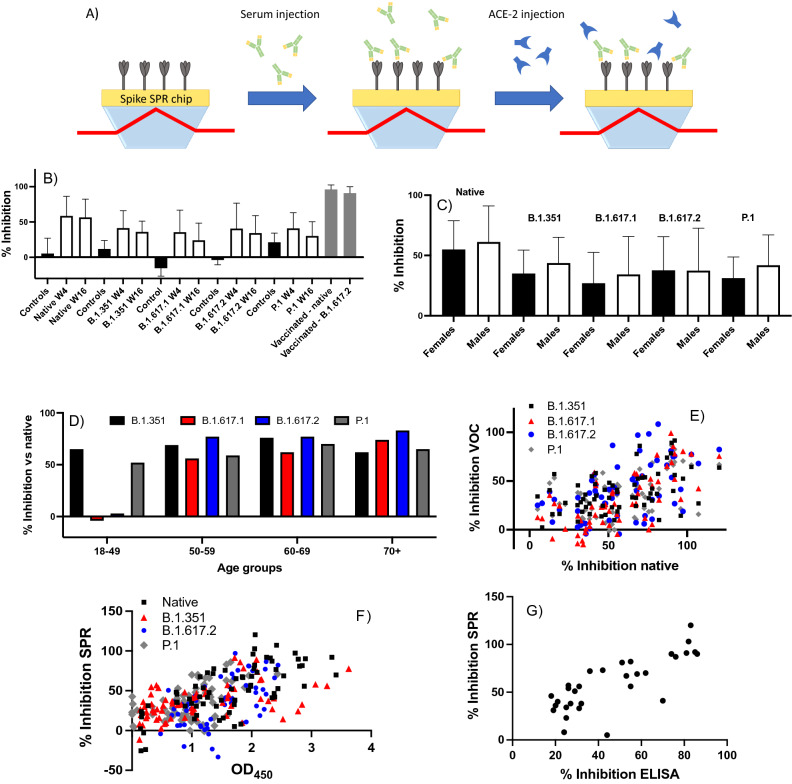
Figure 4.
(A) Schematic illustrating the principle of the SPR pseudo-neutralization assay to quantify the inhibition of the interaction between spike protein and ACE-2 in the presence of SARS-CoV-2-positive sera. Serum from an individual who tested positive for SARS-CoV-2 is injected onto an SPR chip that has been functionalized with spike protein, and a preparation of recombinant human ACE-2 is subsequently injected. A reduced SPR response (and thus higher percent inhibition) is observed if the serum antibodies inhibit the spike–ACE-2 interaction. (B) Observed inhibition of the interaction of ACE-2 with native, B.1.351, B.1.617.2, and P.1 spike proteins by variant-naïve SARS-CoV-2-positive sera (n = 32). Controls: SARS-CoV-2-negative sera (n = 8). Error bars represent one standard deviation. (C) Observed inhibition of the interaction of ACE-2 with native, B.1.351, B.1.617.2, and P.1 spike proteins by variant-naïve SARS-CoV-2-positive sera as a function of sex (females: n = 18; males: n = 14). (D) Normalized inhibition for the B.1.351, B.1.617.1, B.1.617.2 and P.1 variants expressed as a percentage of inhibition compared to the native spike protein for the same age group (n = 8 for each age group). Data from weeks 4 and 16 are pooled. (E) Correlation between the percent inhibition (for weeks 4 and 16 post-diagnosis combined) observed for native and for the B.1.351, B.1.617.1, B.1.617.2 and P.1 spike proteins; each dot corresponds to an average of 2 replicates for a single individual (n = 31 or 32 depending on the data sets). (F) Correlation between the ELISA OD450 results (Fig. 1 and Tables S1, S2) and pseudo-neutralization results for weeks 4 and 16 combined (n = 31 or 32 depending on the data sets). (G) Correlation between the ELISA and SPR pseudo-neutralization results obtained with the native spike protein for the samples at week 4 (n = 31).

