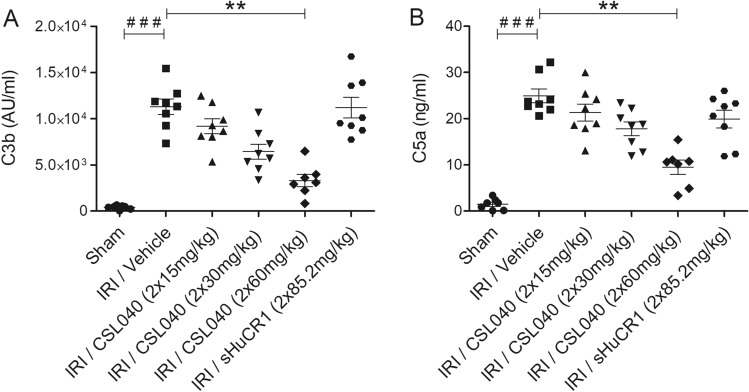
Figure 4.
Attenuation of IR-induced systemic complement activation products C3b and C5a by CSL040 treatment. Plasma samples collected 24 h after reperfusion were analysed for (A) C3b, and (B) C5a by ELISA. Significance was tested using Mann–Whitney U test (###p < 0.001 for sham vs. IRI/vehicle), and One-way ANOVA Kruskal–Wallis and Dunn multiple comparisons test (**p < 0.01 for IRI/vehicle vs. all treatments). The data shown are mean ± SEM (n = 7–8 per group).

