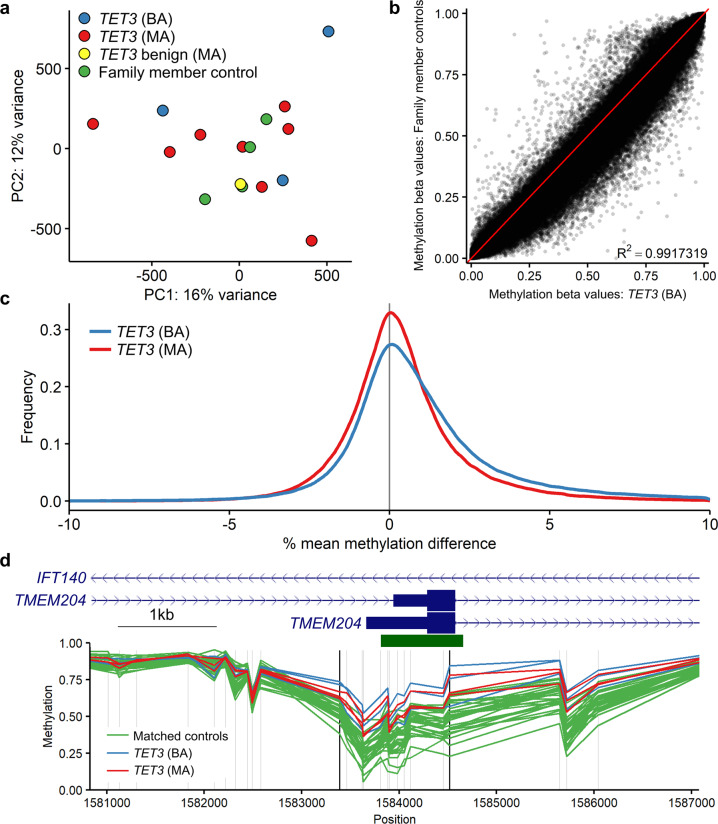
Fig. 1. Overall genome-wide DNA methylation in the TET3 cohort samples.
a Principal components analysis of the TET3 discovery and validation cohorts (samples 1–16, Table 1; n = 3 TET3 (BA), blue; n = 8 TET3 (MA), red; n = 1 TET3 benign (MA), yellow; and n = 4 family member controls, green). b Comparison of mean methylation between the TET3 (BA) samples (n = 3) and family member controls (n = 4). R2 value calculated using Pearson’s correlation coefficient. c Difference in mean methylation between the TET3 (BA) samples (n = 3) and family member controls (n = 4) and the TET3 (MA) samples (n = 3) and family member controls (n = 4). A Kolmogorov-Smirnov test was used to compare the two non-normal distributions and showed the difference to be statistically significant; D = 0.02, P < 2.2e−16. d Differentially methylated region (DMR) at the transcription start site of TMEM204, which overlaps with an intron of IFT140. DNA methylation is compared between TET3 (BA) samples (n = 3), TET3 (MA) samples (n = 3), and matched controls (n = 30). The horizontal green bar indicates a CpG island. Vertical gray lines indicate the location of microarray CpG probes, vertical black lines indicate the boundary of the identified DMR. TET3 (BA), samples with bi-allelic pathogenic TET3 variants; TET3 (MA), samples with mono-allelic pathogenic TET3 variants; TET3 benign (MA), sample with mono-allelic TET3 variant that did not reduce catalytic activity in vitro8; family member controls, family members of affected individuals lacking TET3 variants; matched controls, age-and sex-matched controls.

