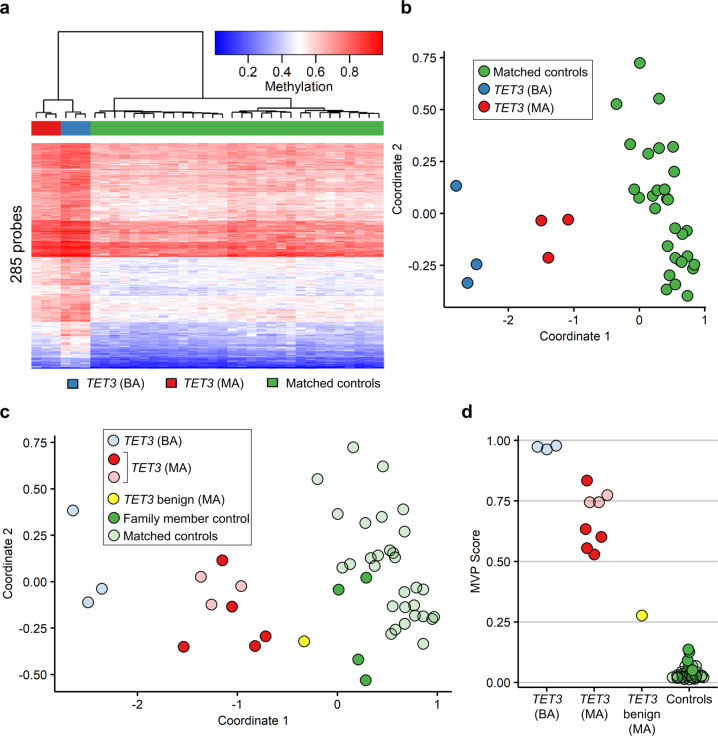
Fig. 2. Identification and validation of an initial TET3 episignature.
a Hierarchical clustering of the TET3 signature discovery samples (n = 3 TET3 (BA), blue; n = 3 TET3 (MA), red) and matched controls (n = 30, green) after the initial round of episignature discovery. Each row of the heatmap represents one CpG probe, and each column represents one individual’s sample. The heatmap color scale from blue to red represents the DNA methylation level (beta value) from 0 (no methylation) to 1 (fully methylated). b Multi-dimensional scaling (MDS) plot of the same signature discovery samples. MDS was performed by scaling of the pair-wise Euclidean distances between samples. c MDS plot and d methylation variant pathogenicity (MVP) score plot of the signature discovery and validation samples. The signature discovery samples are shown partially transparent and were used for training (n = 3 TET3 (BA), light blue; n = 3 TET3 (MA), light red; n = 30 matched controls, light green), and the signature validation samples are opaque and were used for testing (n = 5 TET3 (MA), bright red; n = 1 TET3 benign (MA), bright yellow; n = 4 family member controls, bright green). TET3 (BA), samples with bi-allelic pathogenic TET3 variants; TET3 (MA), samples with mono-allelic pathogenic TET3 variants; TET3 benign (MA), sample with TET3 variant that did not reduce catalytic activity in vitro8; family member controls, family members of affected individuals lacking TET3 variants; matched controls, age-matched and sex-matched controls. See Table 1 for description of samples.

