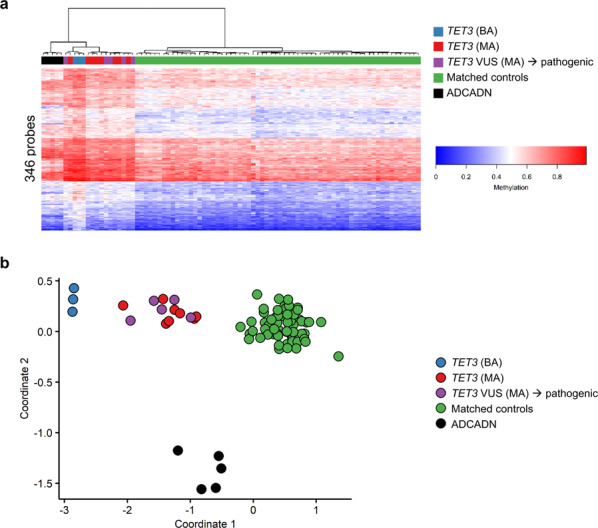
Fig. 4. ADCADN and TET3-deficient samples can be distinguished based on unique DNA methylation patterns.

a Hierarchical clustering of ADCADN (n = 5, black), TET3-deficient (n = 3 TET3 (BA), blue; n = 8 TET3 (MA), red; n = 5 TET3 VUS (MA) → pathogenic, purple), and matched control (n = 64, green) samples. Each row of the heatmap represents one CpG probe, and each column represents one individual’s sample. The heatmap color scale from blue to red represents the DNA methylation level (beta value) from 0 (no methylation) to 1 (fully methylated). Because the ADCADN samples were analyzed using 450K arrays and the TET3-deficient and control samples were analyzed using EPIC arrays, this plot was generated using the 346 probes in the TET3 episignature that are common between the EPIC and 450K arrays. b Multi-dimensional scaling (MDS) plot shows that the TET3 episignature can differentiate between TET3-deficient and ADCADN samples. Color coding and numbers of samples are the same as in a. ADCADN, autosomal dominant cerebellar ataxia, deafness, and narcolepsy; VUS, variant of uncertain significance; TET3 (BA), samples with bi-allelic pathogenic TET3 variants; TET3 (MA), samples with mono-allelic pathogenic TET3 variants; TET3 VUS (MA) → pathogenic, samples with mono-allelic TET3 VUS’s re-classified as pathogenic; matched controls, age-matched and sex-matched controls.
