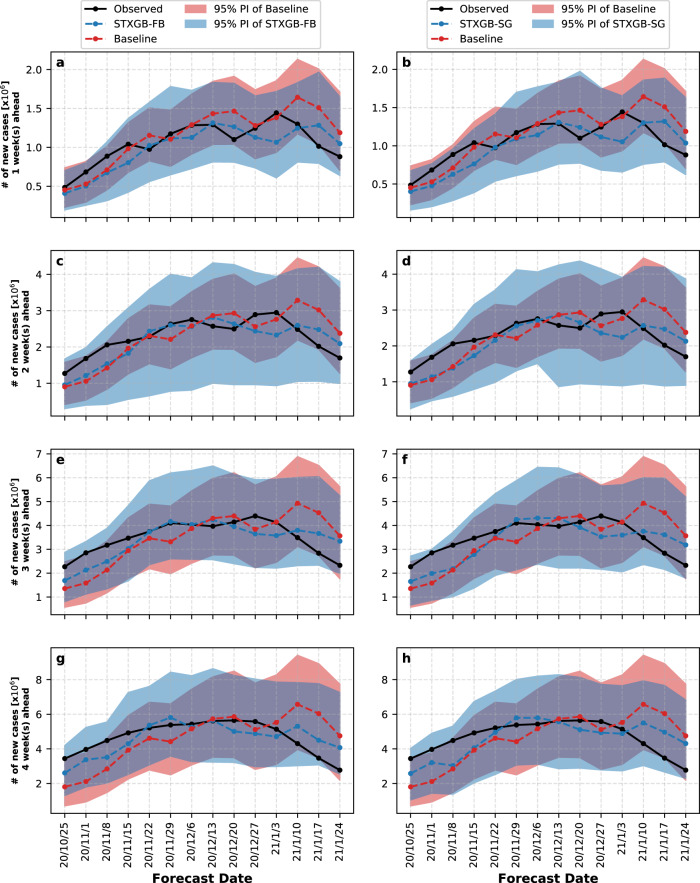
Fig. 3. About 95% prediction interval of the STXGB models compared with the COVIDhub-Baseline over four prediction horizons.
The panels on the left show the predictions of the total number of cases and 95% PIs of STXGB-FB (blue dashed lines and regions, respectively) compared with the COVIDhub-Baseline (red dashed lines and regions). The panels on the right show the predictions of the total number of cases and 95% PIs of STXGB-SG compared with the COVIDhub-Baseline using a similar color scheme. The solid black lines represent the total number of observed cases at each forecast date. a and b One-week horizon, c and d two-week horizon, e and f three-week horizon, and g and h four-week horizon.

