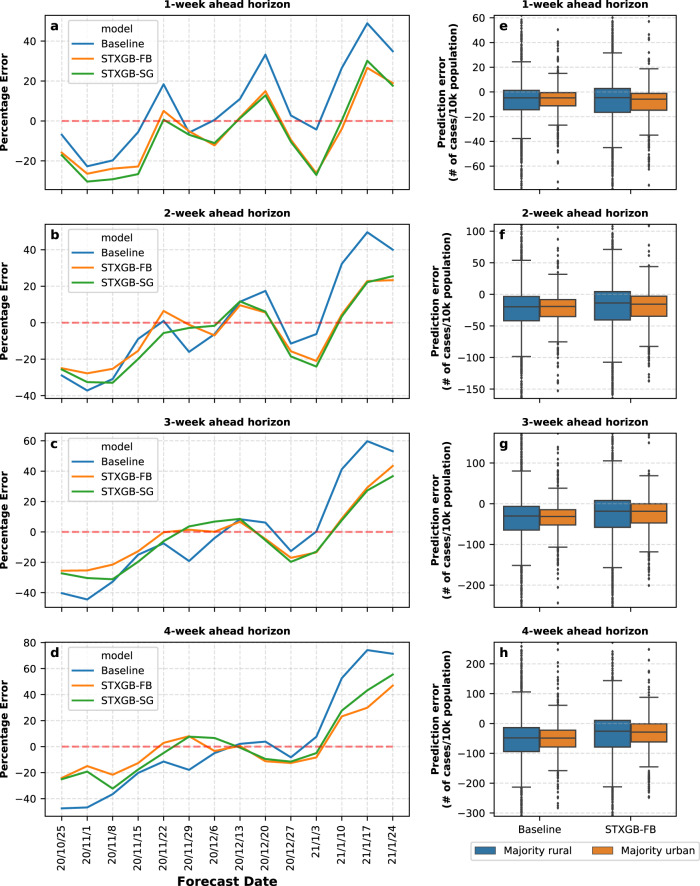
Fig. 5. Percentage error comparison in predicting total new cases and prediction errors in urban vs. rural counties.
a–d The percentage error of STXGB-FB, STXGB-SG, and COVIDhub-Baseline models when predicting the total number of new cases in each prediction horizon. The percentage error is calculated by dividing the difference between the predicted and observed value by the observed value of total (in all counties) new cases. a One-week, b two-week, c three-week, and d four-week ahead prediction horizon. e–h Prediction errors of the number of new cases per 10k population in rural and urban counties on the Nov. 8 forecast date across four prediction horizons. The higher and lower 1% of counties is trimmed from the plot view. Data are presented as means ± SEM (n = 2391 for majority rural group and n = 712 for majority urban group) and whiskers represent 1.5 IQR.

