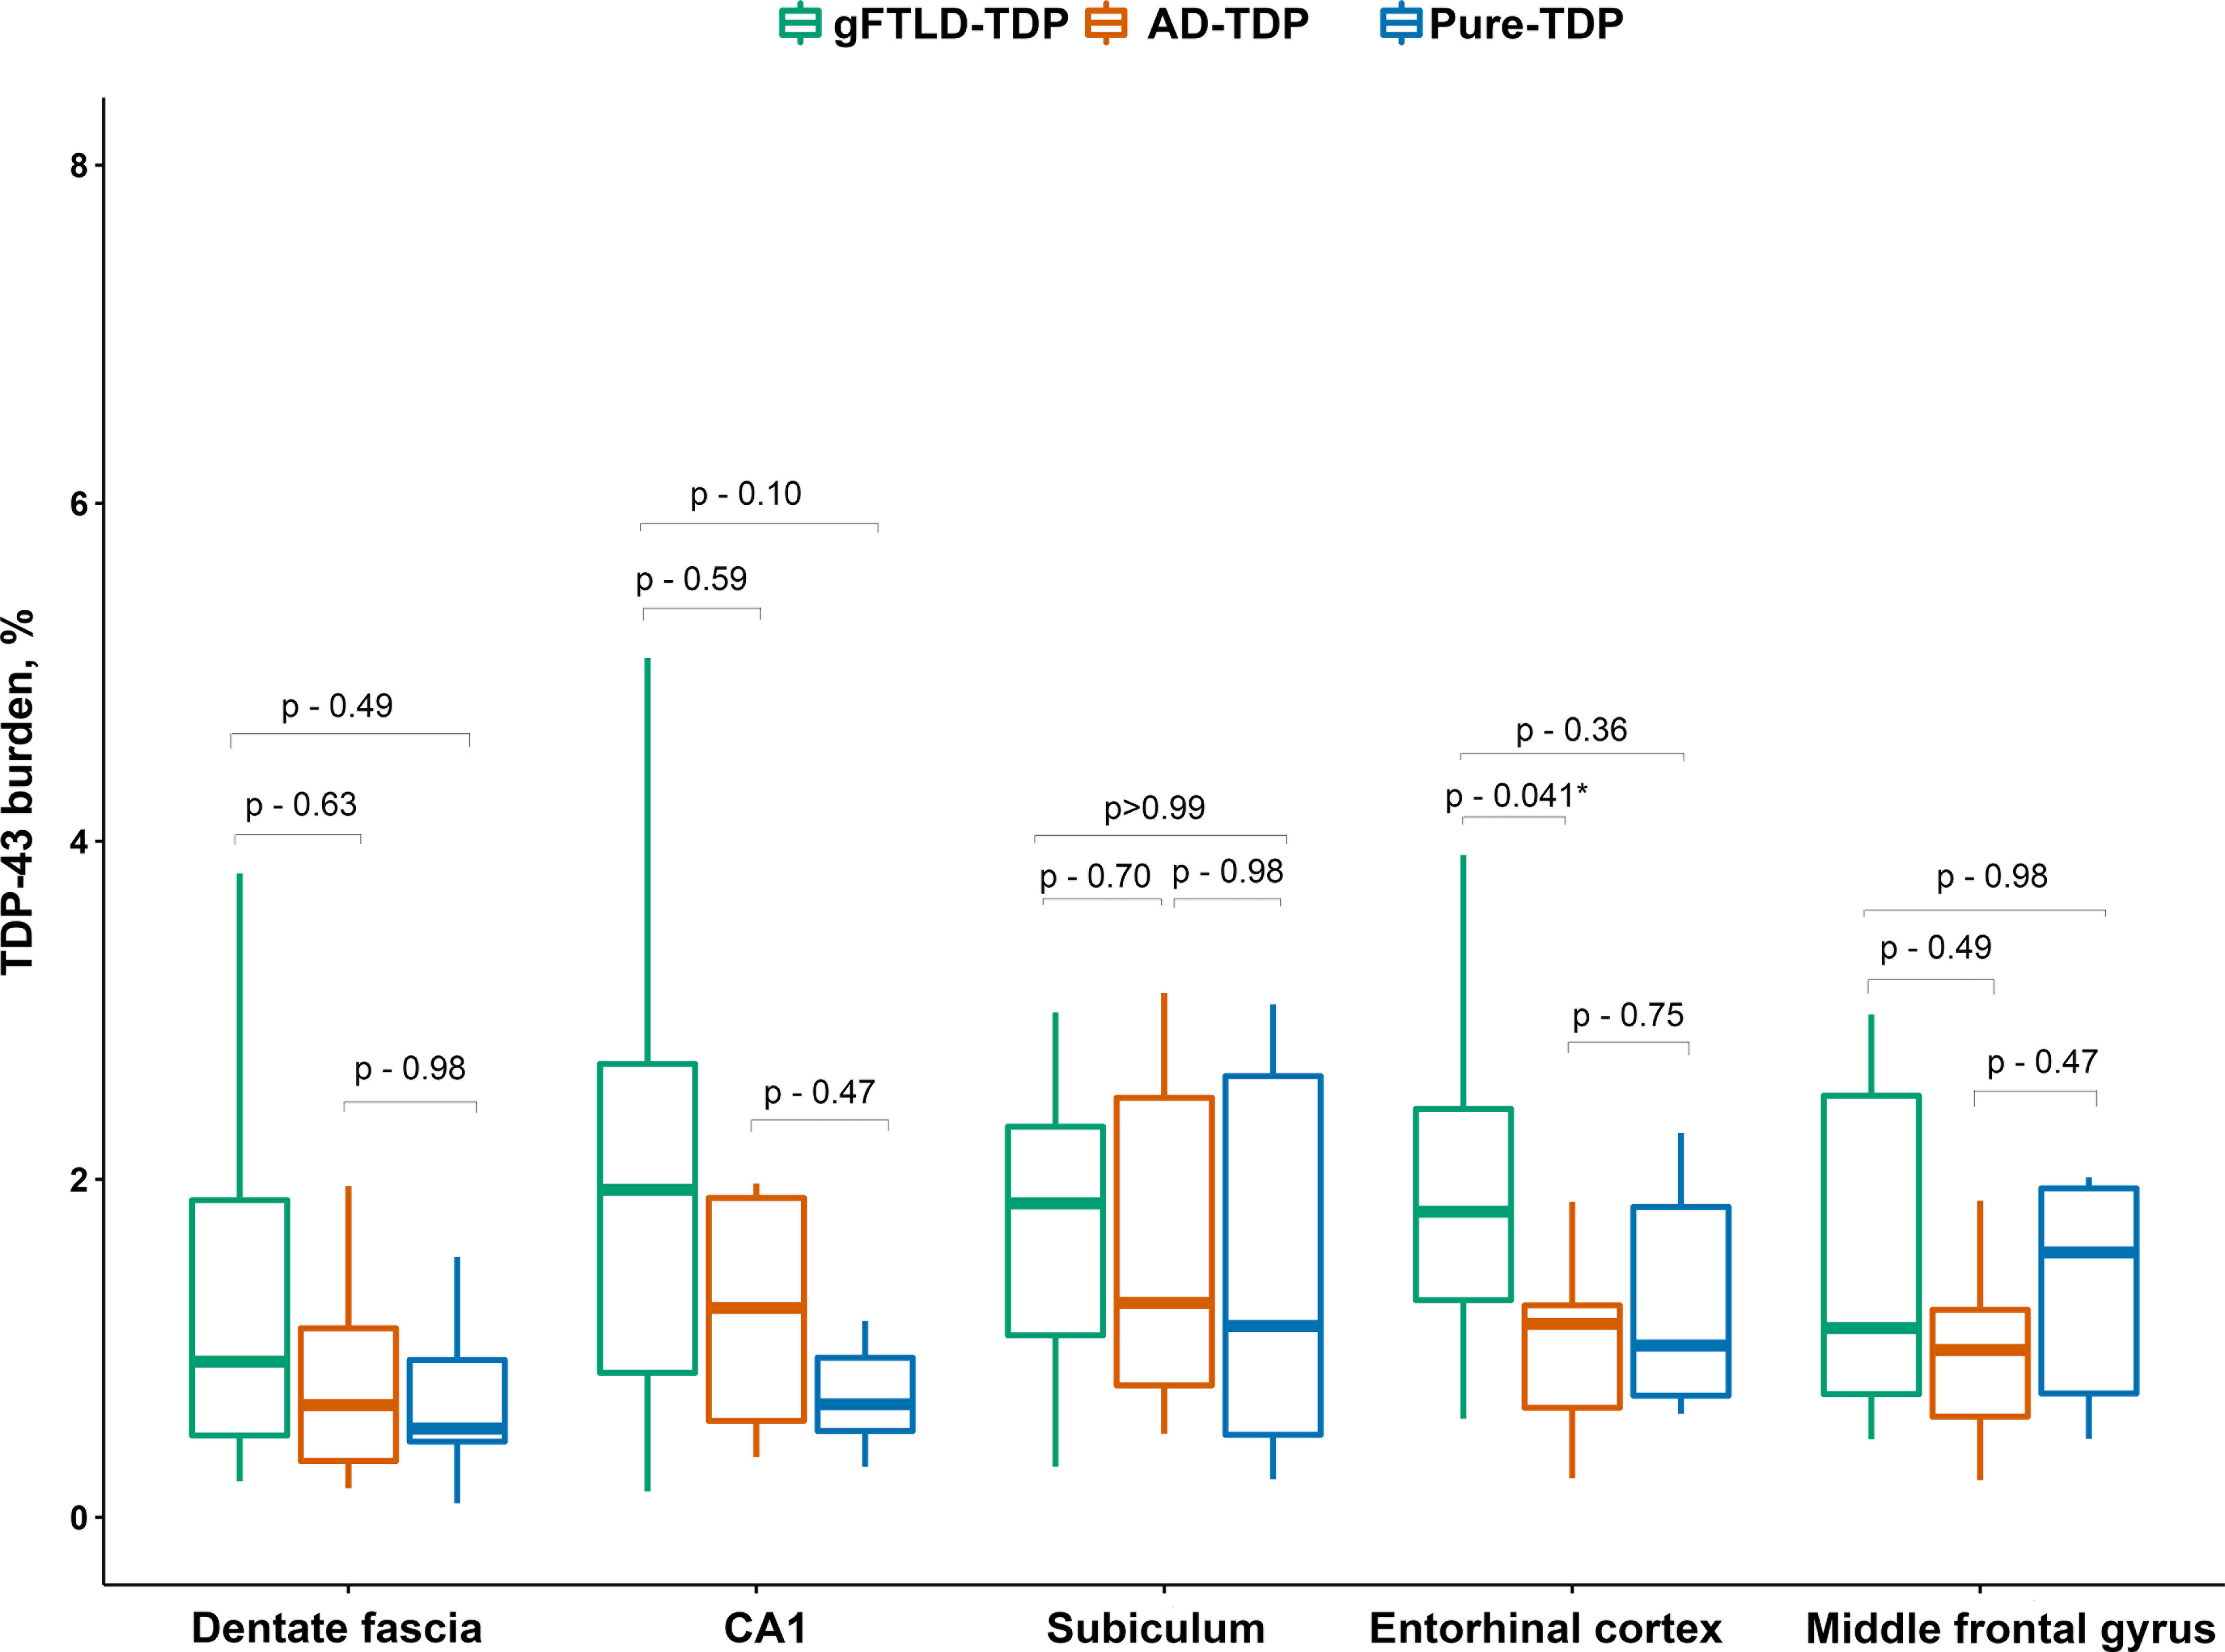
Figure 3. Box plots showing regional TDP-43 burden differences among the three study groups.

The line in box plots represents the median, the box represents interquartile range and the whiskers correspond to minimum and maximum values. P-values are from Steel-Dwass test
