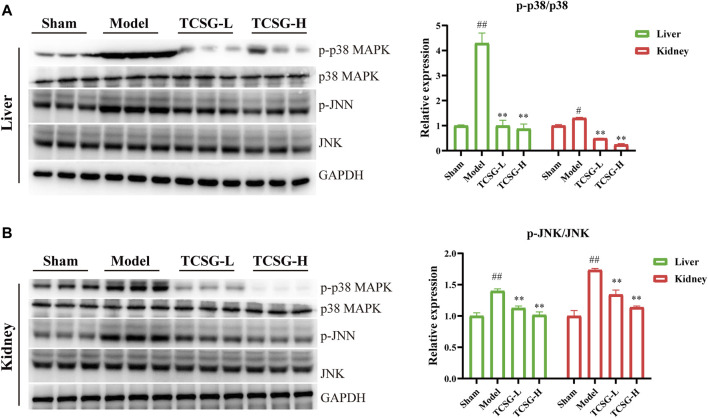
FIGURE 6.
TCSG from Baishouwu repressed p38 MAPK/JNK signaling in the liver and kidney. (A) Western blot and quantitative analysis of p38 MAPK and p-JNK expression in the liver. (B) Western blot and quantitative analysis of p38 MAPK and p-JNK expression in the kidney. Data are shown as means ± SEM (n = 3), # p < 0.05, ## p < 0.01, significantly different from sham group; ** p < 0.01, significantly different from model group.

