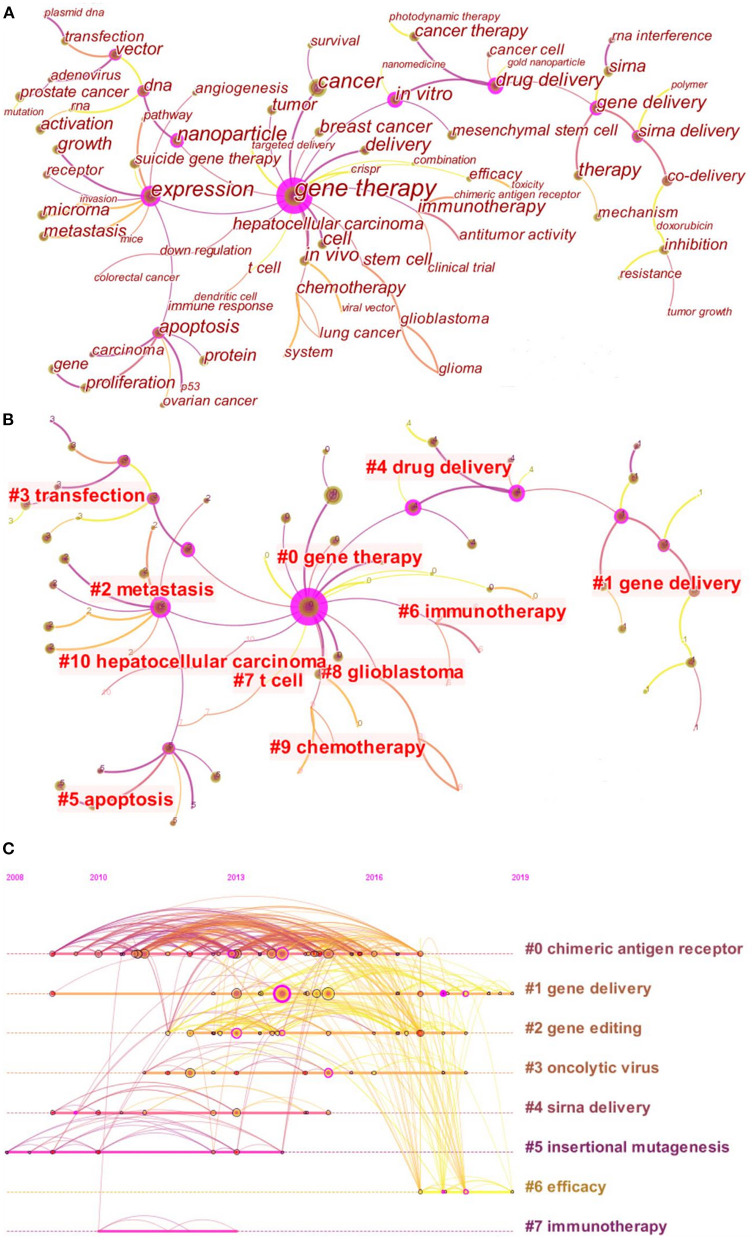
Figure 4.
Analysis of keywords and co-cited references. (A) Co-occurrence network map of keywords; (B) Cluster map of keywords. Each nodes represented a keyword. All the keywords were categorized into 11 clusters, among which the cluster#0, #1, and #4 were the latest (mean year = 2017). The cluster label was the central keyword among all keywords included in the cluster; (C) Timeline view of co-cited references. Each node represented a cited reference, and the number of citation was reflected by the node size. The node volumes of the cluster decreased gradually from cluster#0 to cluster#6. The label of each cluster represented the main topic of the references included in the cluster. The clusters could be ranked by mean year from oldest to latest, namely #5 (2010), #7 (2011), #4 (2012), #0 (2013), #2 (2014), #3 (2014), #1 (2016), and #6 (2018).

