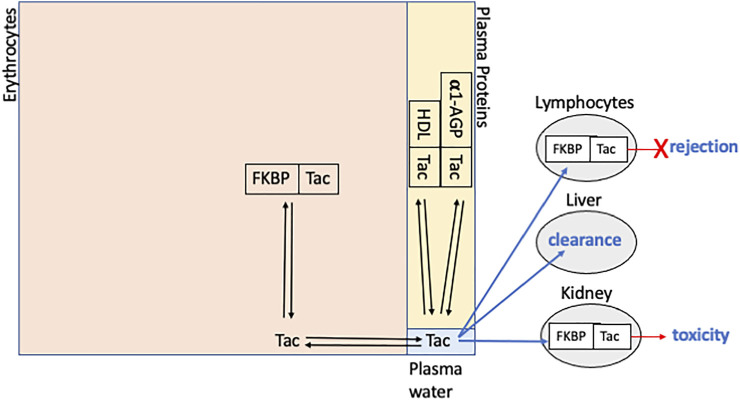
FIGURE 1.
Schematic representation of tacrolimus (Tac) distribution within whole blood showing binding to FKBP12 (FKBP), high density lipoproteins (HDL) and alpha-1 acid glycoprotein (α1-AGP). The large rectangle is divided into sections whose area approximates relative distribution between erythrocytes, plasma proteins and plasma water (unbound tacrolimus). The PBMC compartment is not shown and represents < 1% of tacrolimus in whole blood. Blue arrows indicate distribution into: lymphocytes, where biding with FKBP12 results in inhibition of calcineurin and prevention of rejection; liver, the primary site of clearance; and kidneys, where binding with FKBP12 and inhibition of calcineurin may be associated with nephrotoxicity.

