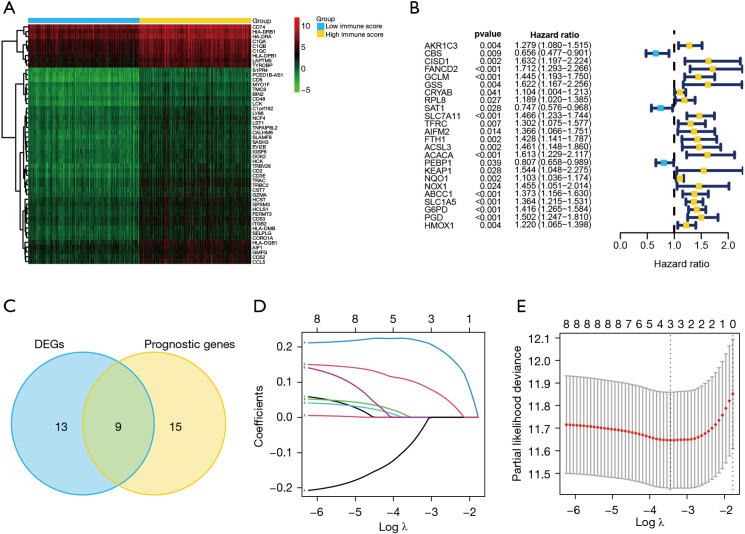
Figure 2.
Establishment of the prediction model using ferroptosis-related genes. (A) Heatmap of DEGs in low- and high-immune scores samples. (B) Forest plots of ferroptosis-associated genes that had significant independent prognostic values for OS in patients with HCC. (C) Venn plot of differentially expressed ferroptosis-associated genes and the independent prognostic values. (D) Determination of the Lasso model coefficient. Each curve represents a variable. The ordinate represents the regression coefficients of the variables used to construct the prediction model. (E) Selection of the number of factors by Lasso Cox regression analysis. The X axis represents the log value of the penalty parameter, lambda. The Y axis represents the partial likelihood deviance error. Partial likelihood deviance was plotted versus log (lambda). The lowest partial likelihood deviance had a correspondence to the optimal number of variables. The two dotted lines correspond to lambda.min on the left and lambda.1se on the right, respectively. The results of the analysis show that three variables are finally used in prediction model establishment. DEGs, differentially expressed genes; HCC, hepatocellular carcinoma.

