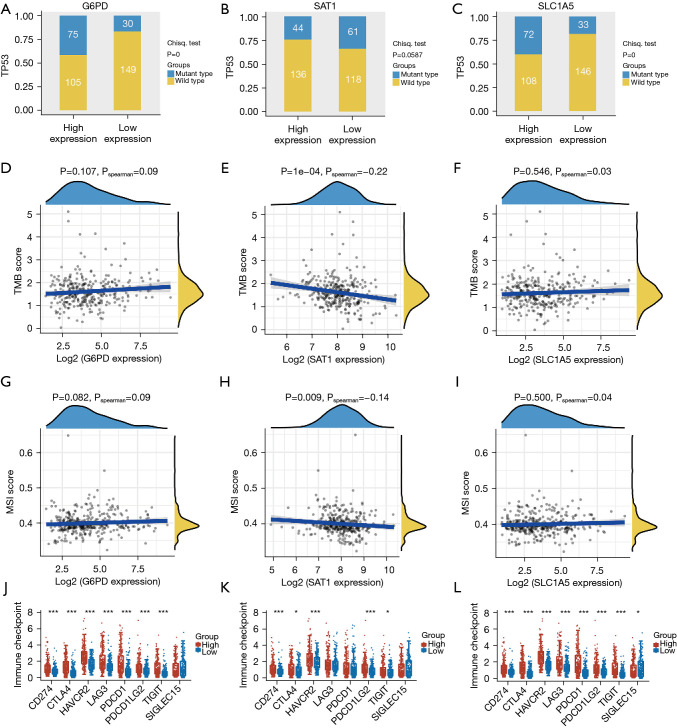
Figure 9.
The correlation between expressions of ferroptosis-associated genes and TP53 mutation, TMB, MSI and immune checkpoints molecules. (A-C) The distribution of TP53 mutation in high- and low-expression groups. The horizontal axis represents the samples of different groups; the vertical axis represents the distribution of the TP53 mutation and different colors represent different mutation types. (D-I) Correlation analysis of three ferroptosis-related genes expression and TMB/MSI. Horizontal axis denotes expression distributions of the gene while the ordinate denotes expression distributions of TMB/MSI scores. Density curve on the right denotes distribution trend of TMB/MSI score; upper density curve denotes distribution trend of the gene. (J-L) The distribution of immune checkpoints related molecules in low- and high-expression groups. The horizontal axis denotes dissimilar sample groups; vertical axis denotes gene expression distributions while different colors denote dissimilar groups. *, P<0.05; ***, P<0.001. TMB, tumor mutation burden; MSI, microsatellite instability.

