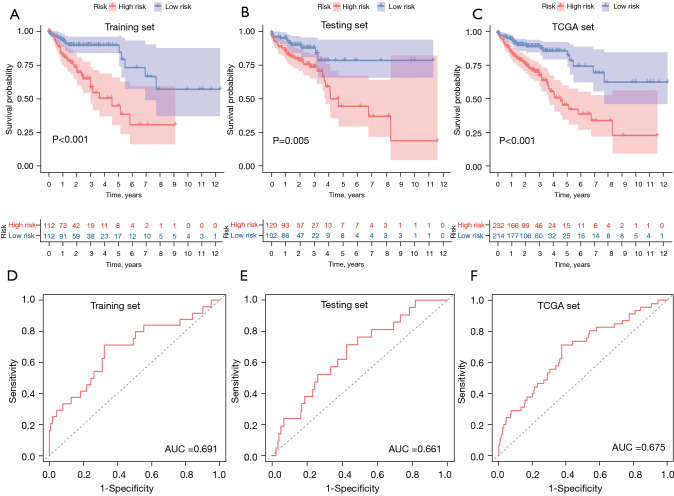
Figure 5.
Kaplan-Meier curves and ROC curves of patients in the high- and low-risk groups. Kaplan-Meier curves of overall survival in low- and high-risk patients from the training (A), test (B), and TCGA (C) sets. Time-dependent ROC curve analysis of the GILncSig in the training (D), test (E), and TCGA (F) sets. ROC, receiver operating characteristic; GILncSig, genome instability-derived lncRNA signature; TCGA, The Cancer Genome Atlas.

