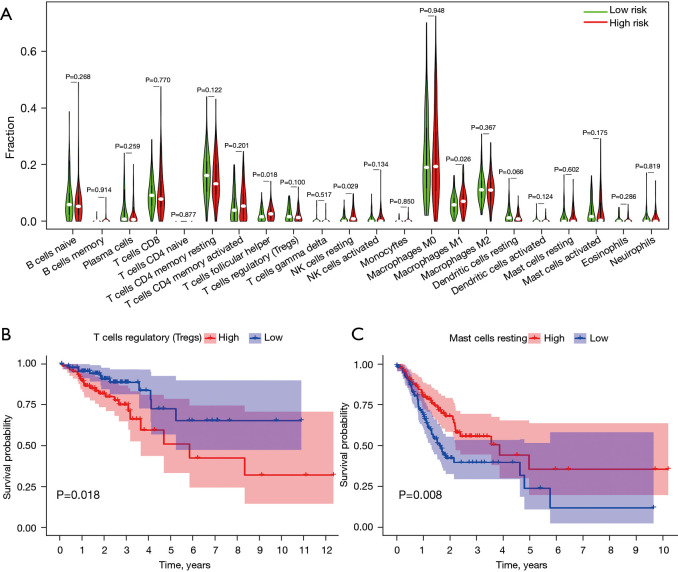
Figure 7.
The landscape of immune infiltration in COAD. (A) The comparison of the fractions of immune cells between the high- and low-risk groups. Kaplan-Meier survival analysis of overall survival between patients with high and low levels of infiltrating Tregs (B) and resting mast cells (C). COAD, colon adenocarcinoma; Tregs, regulatory T cells.

