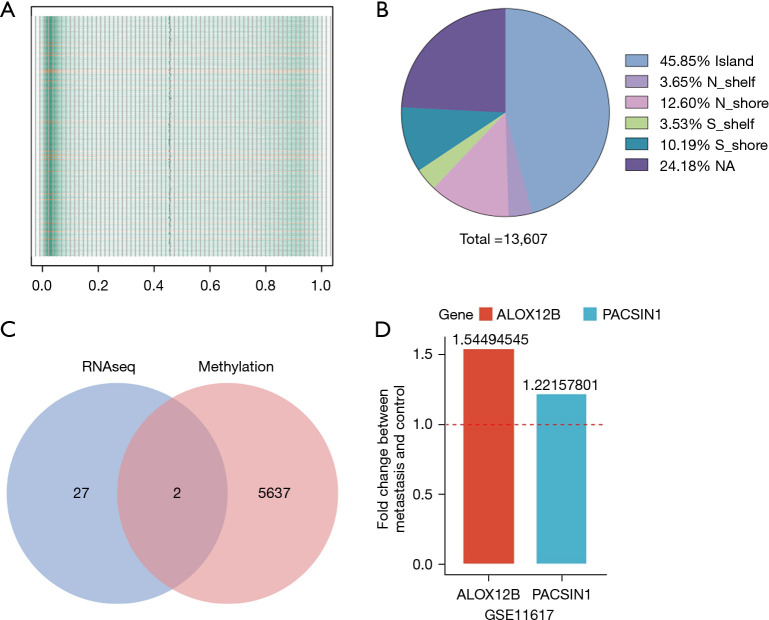
Figure 3.
Overall methylation expression level in all gastric cancer samples (M0: green; M1: orange) (A), low methylation level was showed in both M0 and M1 group. Methylation level was scaled from 0 to 1. Genomic location of DMPs between M0 and M1 group (B). Gene overlap by high expression RNA level and low methylation level in M1 group comparing with M0 group (C). Up-regulation of overlapped genes in GSE11617 (D). DMPs, different methylated probes.

