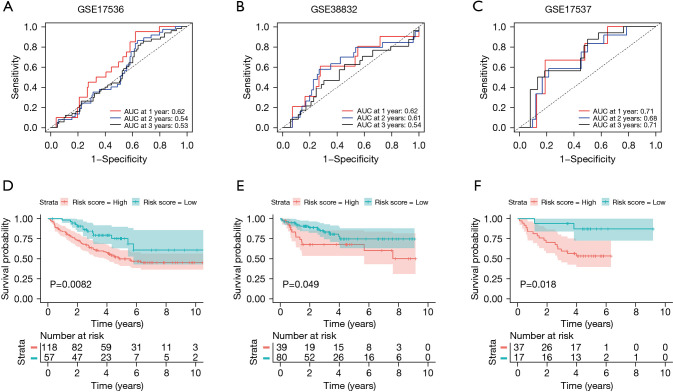
Figure 5.
The validation of prognostic results in datasets from the GEO database. (A-C) Time-dependent ROC curve validation of prognostic results for 1-, 2-, and 3-year OS predictions. (D-F) Patients in high-risk group suffered shorter survival intervals in the 3 GEO datasets. GEO, Gene Expression Omnibus; ROC, receiver operating characteristic; OS, overall survival.

