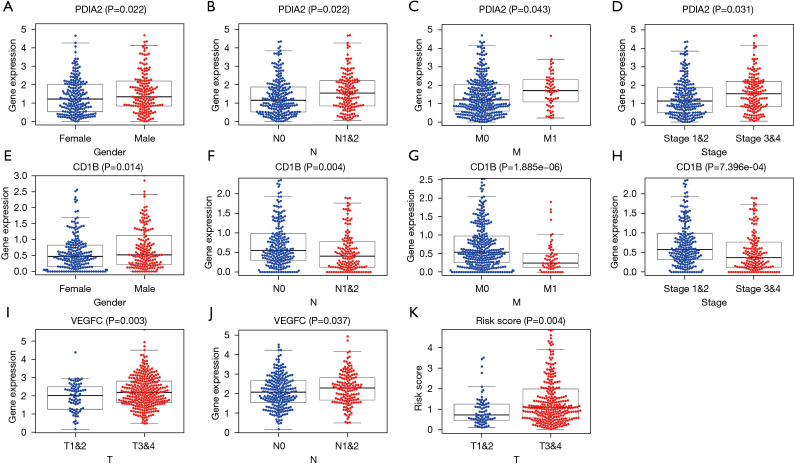
Figure 7.
Relationships between the factors in the model and the clinical characteristics of samples in the entire TCGA cohort (P<0.05). (A) PDIA2 expression and gender. (B) PDIA2 expression and lymph node metastasis. (C) PDIA2 expression and distant metastasis. (D) PDIA2 expression and pathological stage. (E) CD1B expression and gender. (F) CD1B expression and lymph node metastasis. (G) CD1B expression and distant metastasis. (H) CD1B expression and pathological stage. (I) VEGFC expression and T stage. (J) PDIA2 expression and lymph node metastasis. (K) Risk score and T stage. TCGA, The Cancer Genome Atlas.

