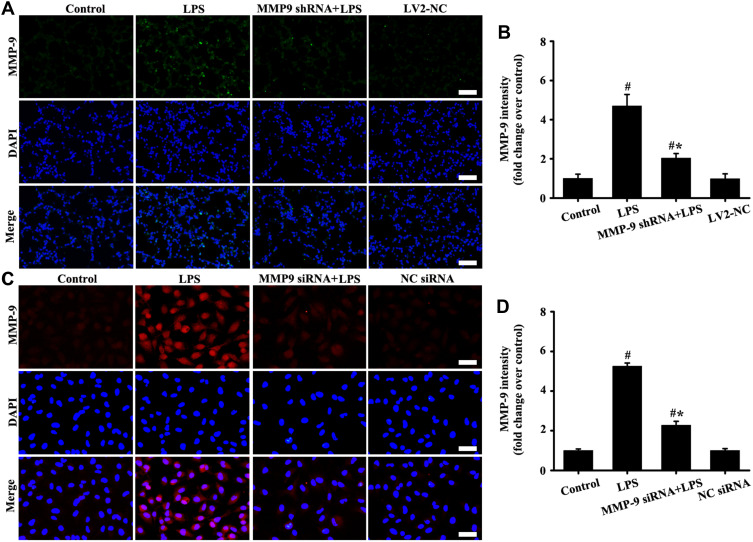
Figure 5.
Downregulation MMP-9 expression in vivo and in vitro. The mice were injected by tail vein with a of total 2U MMP-9 shRNA, and then exposed to LPS for stimulation of six hours LPS. The A549 cells were transfected with 40 nM MMP-9 siRNA and Lipofectamine 2000 for 48 hours, and then added with LPS (100 ng/mL) for stimulation of six hours. MMP-9 in vivo (A, magnification, × 200; scale bar, 50 μm) and vitro (C, magnification, × 200; scale bar, 50 μm) was detected by immunofluorescence. (B and D) are fluorescence intensity analysis of (A and C) respectively. All data are presented as the mean ± SD of three independent experiments. #p < 0.05 vs the control group, #*p < 0.05 vs the LPS group.

