Fig. 2.
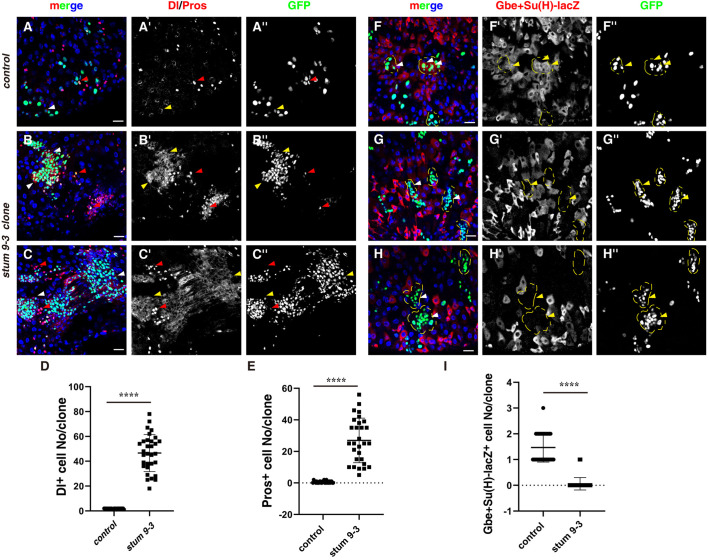
stum 9-3 affects Notch signaling. (A) Dl (ISC marker) and Pros (EE marker) (red) in intestines with control MARCM clones (white and red arrowheads). Dl/Pros and GFP channels are showed separately in black-white. Please note that EE cell could be observed in some control ISC clones (red arrowhead). (B,C) Dl and Pros (red) in intestines with stum 9-3 ISC MARCM clones (white and red arrowheads). Please note that the number of Dl+ and Pros+ cells is dramatically increased. Two types of clones are observed: ISC clones and EE clones. (D) Quantification of the number of Dl+ cells per clone in control and stum 9-3 intestines. n=25–35. Mean±s.d. is shown, ****P<0.0001. Please note that stum 9-3 ISC clones are deformed, preventing accurate quantification of Dl+ cells per clone. (E) Quantification of the number of EE cells per clone in control and stum 9-3 intestines. n=25–35. Mean±s.d. is shown, ****P<0.0001. Please note that stum 9-3 ISC clones are deformed, preventing accurate quantification of EE cells per clone. (F) Gbe+Su(H)-lacZ cells (Notch signaling reporter, EBs, red) in control ISC MARCM clones (labeled with yellow dotted lines, white arrowheads). Please note that these clones contain several Gbe+Su(H)-lacZ+ cells, indicating that Notch signaling is activated in these clones. Gbe+Su(H)-lacZ and GFP channels are showed separately in black-white. (G,H) Gbe+Su(H)-lacZ cells (EBs, red) in stum 9-3 ISC MARCM clones (with yellow dotted lines, white arrowheads). Please note that no Gbe+Su(H)-lacZ+ cells are observed in these clones, indicative of defective Notch signaling. (I) Quantification of the number of Gbe+Su(H)-lacZ+ cells per clone in control and stum 9-3 intestines. n=25–35. Mean±s.d. is shown, ****P<0.0001. GFP is in green, blue indicates DAPI staining for DNA. Scale bars: 20 μm. Yellow arrows correspond to the white arrows, pointing to the cells that the white arrows pointed to.

