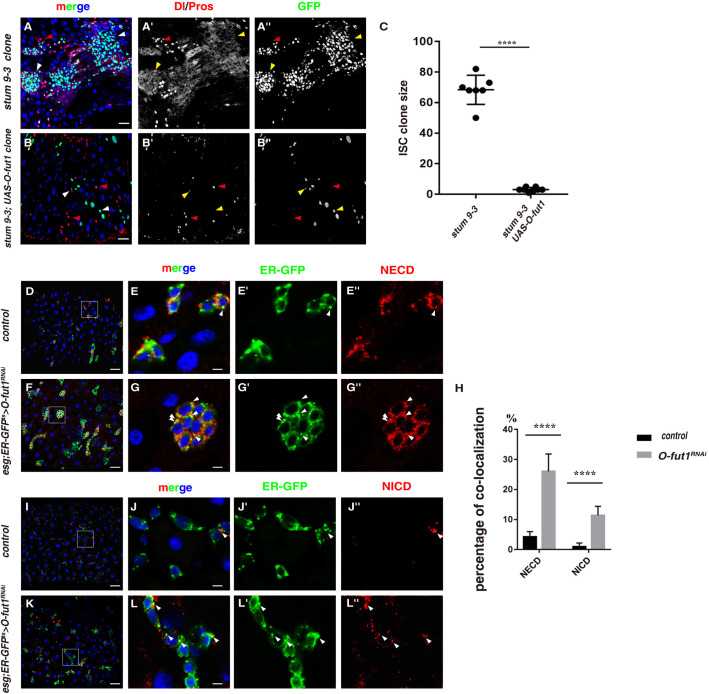
Fig. 4.
stum 9-3 is a new allele of O-fut1. (A) Dl and Pros (red) in stum 9-3 ISC MARCM clones (white and red arrowheads). Dl/Pros and GFP channels are showed separately in black-white. (B) Expression of UAS-O-fut1 could completely rescue defects observed in stum 9-3 ISC MARCM clones (white and red arrowheads). (C) Quantification of the size of ISC MARCM clones in different genotypes indicated. Mean±s.d. is shown. n=5–10 intestines. ****P<0.0001. Please note that stum 9-3 ISC clones are deformed, preventing accurate quantification of clone size. (D–E″) NECD (red) is rarely detected in the ER (green, by KDEL-GFP) in progenitors (white arrowhead). Split channels of ER-GFP and NECD are showed separately. The boxed region in D is showed enlarged in E. (F–G″) Increased NECD puncta (red) are detected in the ER (green) in progenitors of esgts>O-fut1RNAi intestines (white arrowheads). The boxed region in F is showed enlarged in G. (H) Quantification of the percentage of NECD or NICE within the ER in progenitors in control and esgts>O-fut1RNAi intestines. (I–J″) NICD (red) is rarely detected in the ER (green, by KDEL-GFP) in progenitors (white arrowhead). Split channels of ER-GFP and NICD are showed separately. The boxed region in I is showed enlarged in J. (K-L″) Increased NICD puncta (red) are detected in the ER (green) in progenitors of esgts>O-fut1RNAi intestines (white arrowheads). The boxed region in K is showed enlarged in L. In all panels except graphs, GFP is in green, blue indicates DAPI staining for DNA. Scale bars: 20 μm (A,B,D,F,I,K) and 5 μm (E,G,J,L). Yellow arrows correspond to the white arrows, pointing to the cells that the white arrows pointed to.

