
FIGURE 3.
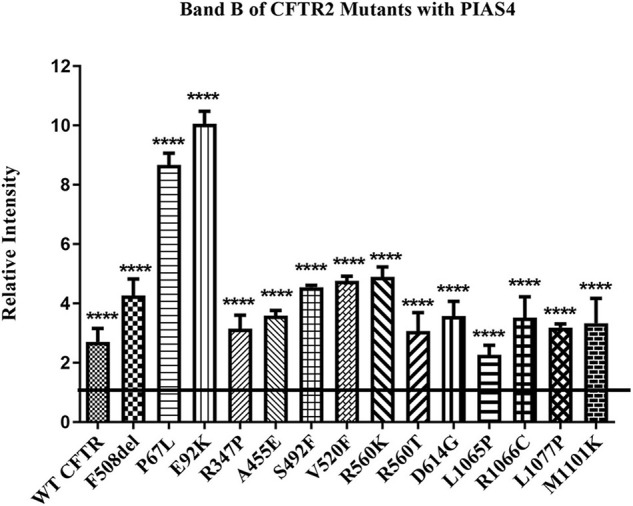
Effect of PIAS4 on band B expression in CFTR2 mutants. CFBE41o- cells were transfected with a CFTR2 mutant with or without PIAS4. SDS–PAGE was performed, and intensities of the bands were analyzed on a Li-Cor Odyssey IR imaging system. The control band B level for each mutant was set to a value of 1.0, depicted by the horizontal line, whereas the height of each bar represents band B level relative to that of the control. PIAS4 co-expression increased band B intensity for each mutant. ****P < 0.0001.