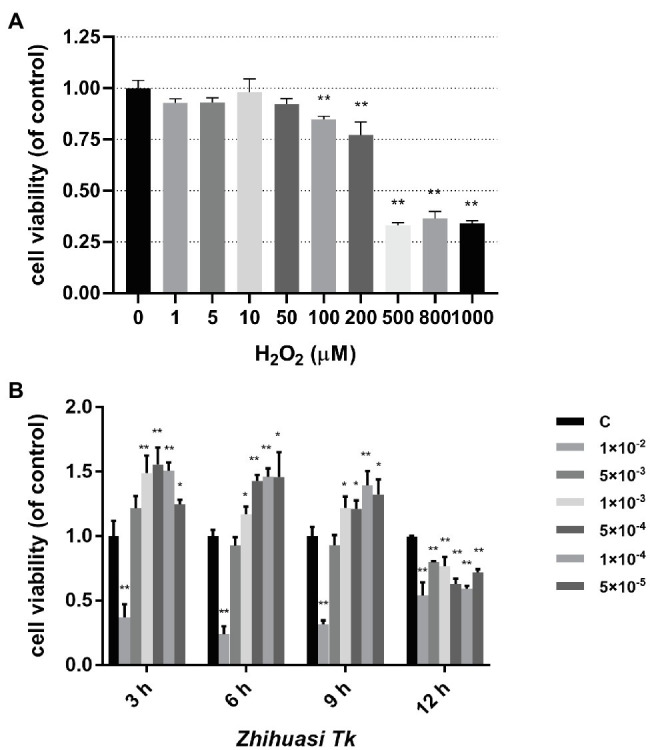
Figure 1.

Effects of H2O2 (A) and Z. Tk (B) of different concentrations on the viability of IPEC-J2 cells treated with different times. Symbols “*” and “**” indicate the significant differences compared with the control group set at the values of p of 0.05 and 0.01, respectively.
