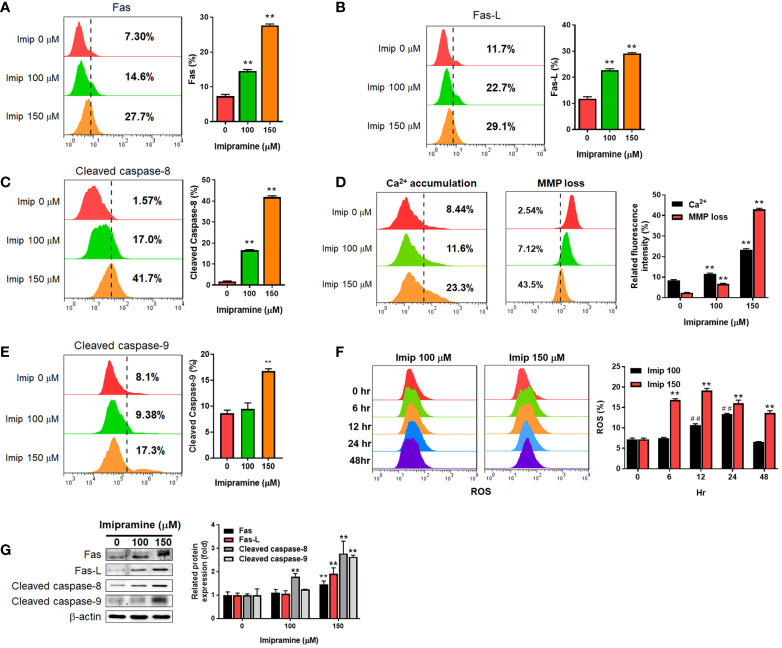
Figure 2.
The induction of extrinsic and intrinsic apoptosis by imipramine in CL1-5-F4 cells. (A–E) Staining pattern and quantification results of Fas, Fas-L, cleaved caspase-8, Ca2+, ΔΨm and cleaved caspase-9 after 100 and 150 μM imipramine treatments for 48 hr are displayed. (F) The ROS staining and quantification results of 100 and 150 μM imipramine treatment for 0, 6, 12, 24 and 48 hr are displayed. (G) The protein expression pattern and quantification results of Fas, Fas-L, cleaved caspase-8 and cleaved caspase-9 after 100 and 150 μM imipramine treatments for 48 hr are displayed. (** p < 0.01 vs. 0 μM imipramine; ## p < 0.01 vs. 0 hr).

