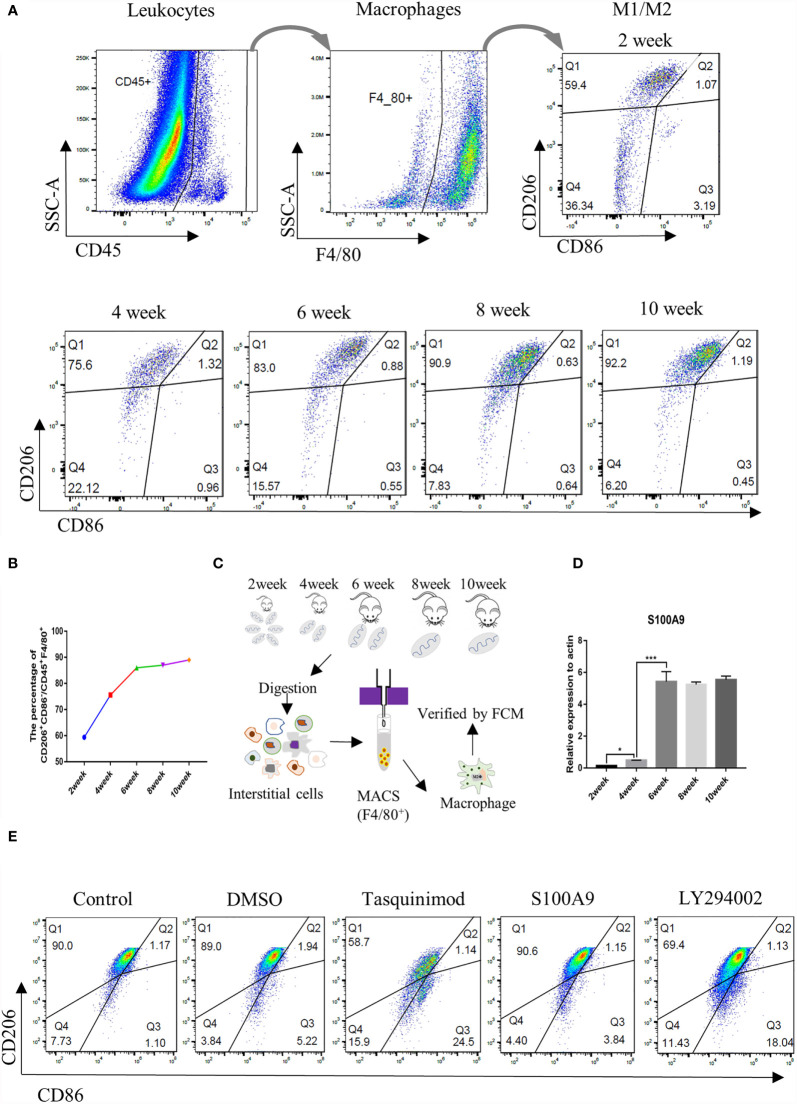
Figure 2.
Ratio of M2 TMs and S100A9 mRNA expression increases with the development of mouse testis. (A) Gating strategy that describes CD45+F4/80+ mouse testis fraction and the distinction of M2 (CD206+CD86-) and M1 (CD206-CD86+) population, represented by Q1 and Q3 respectively (2week, n=4/group; 4-6week, n=3/group; 8-10week, n=2/group). (B) Percentage of M2Φ in different age of TMs by FCM. (C) Flow chart of preparation for TMs, testes from weeks 2 to 10 were digested and interstitial cells were incubated with F4/80 magnetic beads (2week, n=8/group; 4-6week, n=6/group; 8-10week, n=4/group). TMs were obtained by magnetic cell sorting (MACS), and the purity was verified by flow cytometry for subsequent experiment. (D) Relative mRNA expression of S100A9 at different ages of TM (2week, n=6/group; 4-6week, n=5/group; 8-10week, n=4/group). (E) Percentage of M2Φ in adult mouse testis (8week, n=2/group) under physiological conditions decreased with the treatment of S100A9 inhibitor (tasquinimod) or PI3K inhibitor (LY294002), compared with the control group. DMSO and S100A9 groups were used as control. Data represent the mean ± standard error (n=2-3). Significant differences between the two groups are indicated as *P < 0.05, ***P < 0.001; comparisons between groups using one-way ANOVA followed by Dunnett’s multiple comparisons test.

