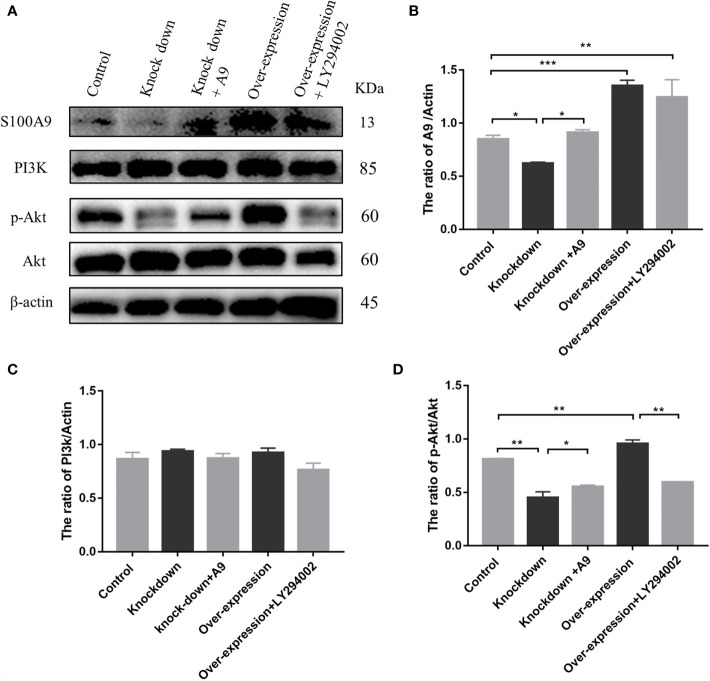
Figure 4.
S100A9 treatment activates PI3K/Akt pathway in Raw 264.7 macrophage cells. (A) Western blot results and quantification data of S100A9, PI3K, p-Akt, and Akt expression in different groups. Quantification data of Western blot analysis results for the ratio of (B) S100A9/Actin, (C) PI3K/Actin, and (D) p-Akt/Akt. Data are presented as mean ± standard error (n=2–3); *P < 0.05, **P < 0.01, ***P < 0.001; comparisons between groups using one-way ANOVA followed by Dunnett’s multiple comparisons test.

