Figure 3.
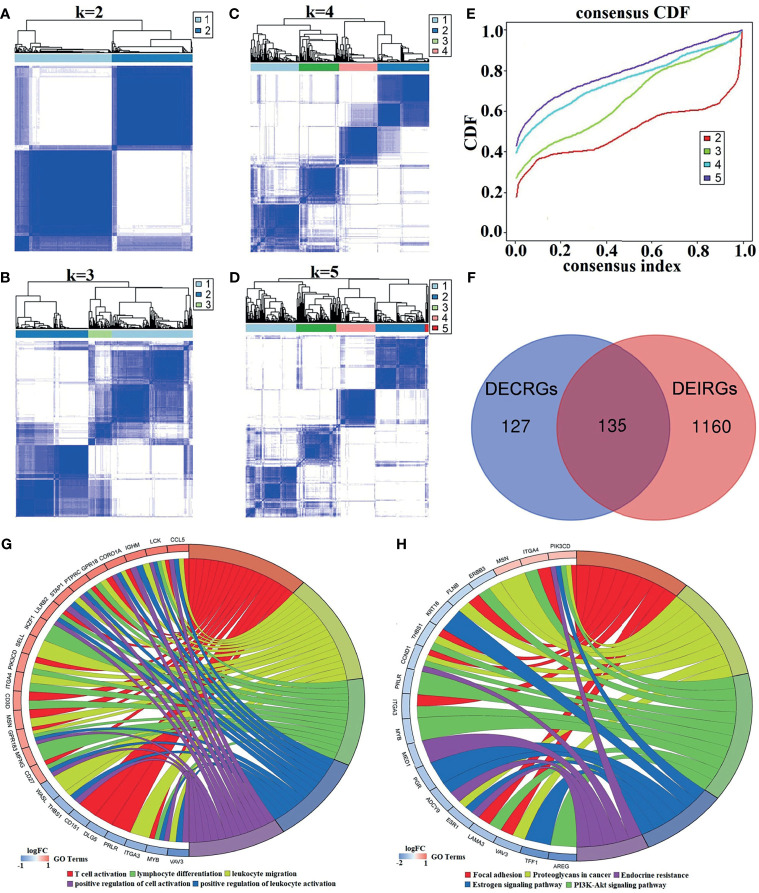
The process of identifying K values and DECIRGs and the results of the enrichment analysis. (A–D) The consensus matrix (CM) plots. (A) K = 2; (B) K = 3; (C) K = 4; (D) K = 5. (E) The cumulative distribution function (CDF) plots. (F) Venn plot of the intersection of DECRGs and DEIRGs. (G) The GO enrichment results of the 135 DECIRGs (only the top 5 items). (H) The KEGG enrichment results of the 135 DECIRGs.

