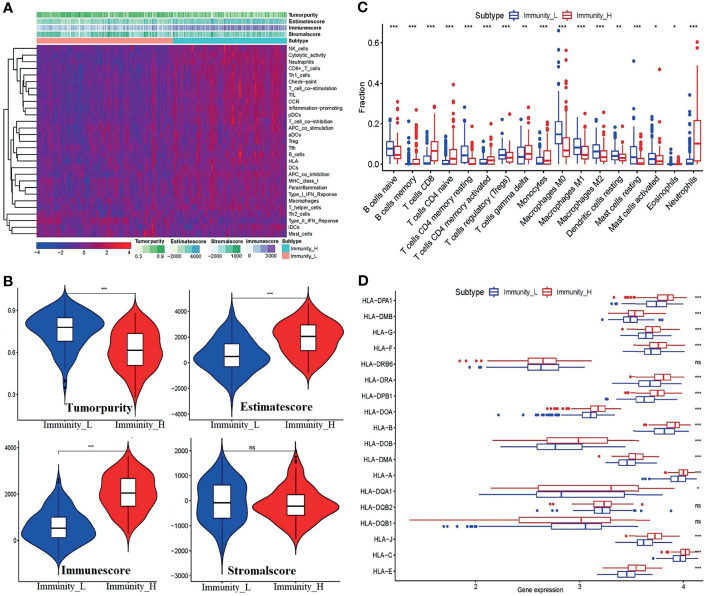
Figure 4.
Validation of the feasibility of the immune grouping strategy. (A) Heatmap of tumor purity, ESTIMATE score, immune score, and stromal score. (B) Violin plots showing the comparisons of the tumor purity, ESTIMATE score, immune score, and stromal score between the Immunity-L and Immunity-H subtypes. (C) The fraction of 17 kinds of immune cell infiltration scores between the two groupings. (D) Boxplot of HLA gene expression between the two groups. *p < 0.05, **p < 0.01,***p < 0.001, ns, no significant differences.

